
Page 214 - UKZN Proceedings of the Conference Report
P. 214
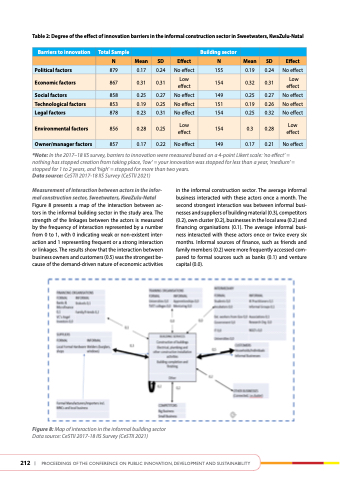
table 2: degree of the effect of innovation barriers in the informal construction sector in Sweetwaters, KwaZulu-Natal
 Barriers to innovation
 total Sample
    Building sector
     N
 Mean
 Sd
 effect
 N
 Mean
 Sd
 effect
 Political factors
  879
  0.17
  0.24
  No effect
  155
  0.19
  0.24
  No effect
 economic factors
867
0.31
0.31
Low effect
154
0.32
0.31
Low effect
 Social factors
  858
  0.25
  0.27
  No effect
  149
  0.25
  0.27
  No effect
 technological factors
853
0.19
0.25
No effect
151
0.19
0.26
No effect
 Legal factors
  878
  0.23
  0.31
  No effect
  154
  0.25
  0.32
  No effect
 environmental factors
856
0.28
0.25
Low effect
154
0.3
0.28
Low effect
 owner/manager factors
  857
  0.17
  0.22
  No effect
  149
  0.17
  0.21
  No effect
    *Note: In the 2017–18 IIS survey, barriers to innovation were measured based on a 4-point Likert scale: ‘no effect’ = nothing has stopped creation from taking place, ‘low’ = your innovation was stopped for less than a year, ‘medium’ = stopped for 1 to 2 years, and ‘high’ = stopped for more than two years.
Data source: CeSTII 2017-18 IIS Survey (CeSTII 2021)
Measurement of interaction between actors in the infor- mal construction sector, Sweetwaters, KwaZulu-Natal Figure 8 presents a map of the interaction between ac- tors in the informal building sector in the study area. The strength of the linkages between the actors is measured by the frequency of interaction represented by a number from 0 to 1, with 0 indicating weak or non-existent inter- action and 1 representing frequent or a strong interaction or linkages. The results show that the interaction between business owners and customers (0.5) was the strongest be- cause of the demand-driven nature of economic activities
in the informal construction sector. The average informal business interacted with these actors once a month. The second strongest interaction was between informal busi- nesses and suppliers of building material (0.3), competitors (0.2), own cluster (0.2), businesses in the local area (0.2) and financing organisations (0.1). The average informal busi- ness interacted with these actors once or twice every six months. Informal sources of finance, such as friends and family members (0.2) were more frequently accessed com- pared to formal sources such as banks (0.1) and venture capital (0.0).
 212
| Proceedings of the conference on Public innovation, develoPment and sustainability
Figure 8: Map of interaction in the informal building sector Data source: CeSTII 2017-18 IIS Survey (CeSTII 2021)
