
Page 215 - UKZN Proceedings of the Conference Report
P. 215
Interaction with education and training organisations (both formal and informal) such as universities and col- leges were non-existent. This was expected because the activities offered by informal construction businesses are driven by customer demand. Business owners did not in- teract with formal intermediary actors such as government agencies. In same vein, business owners reported weak in- teraction with informal intermediaries such as indigenous knowledge (IK) practitioners (0.1), NGOs (0.0) associations (0.1) and informal groups. These results suggest that busi- ness owners work in silos and are not making use of train- ing organisations to improve their knowledge or skills.
PCA analysis of innovation characteristics of informal construction sector in Sweetwaters, KwaZulu-Natal Principal component analysis (PCA) analysis was conducted to reduce the dimensionality of the dataset
and identify the underlying latent variables (Hasan and Abdulazeez 2021) on variables that characterise the nature of innovation in the informal construction businesses. The PCA extracted 13 principal components, which explained a total of 100% of the variance in the data. The number of components was determined using the Kaiser criterion (eigenvalues greater than 1) and scree plot analysis (Braeken and Van Assen 2017).
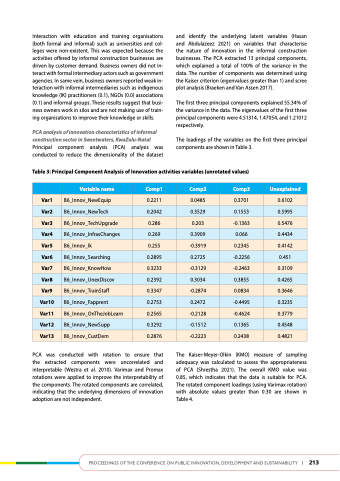
The first three principal components explained 55.34% of the variance in the data. The eigenvalues of the first three principal components were 4.51314, 1.47054, and 1.21012 respectively.
The loadings of the variables on the first three principal components are shown in Table 3.
table 3: Principal Component analysis of Innovation activities variables (unrotated values)
variable name
Comp1
Comp2
Comp3
unexplained
var1
B6_Innov_NewEquip
0.2211
0.0485
0.3701
0.6102
var2
B6_Innov_NewTech
0.2042
0.3529
0.1553
0.5995
var3
B6_Innov_TechUpgrade
0.286
0.203
-0.1363
0.5476
var4
B6_Innov_InfrasChanges
0.269
0.3909
0.066
0.4434
var5
B6_Innov_Ik
0.255
-0.3919
0.2345
0.4142
var6
B6_Innov_Searching
0.2895
0.2725
-0.2256
0.451
var7
B6_Innov_KnowHow
0.3233
-0.3129
-0.2463
0.3109
var8
B6_Innov_UnexDiscov
0.2392
0.3034
0.3855
0.4265
var9
B6_Innov_TrainStaff
0.3347
-0.2874
0.0834
0.3646
var10
B6_Innov_Fapprent
0.2753
0.2472
-0.4495
0.3235
var11
B6_Innov_OnTheJobLearn
0.2565
-0.2128
-0.4624
0.3779
var12
B6_Innov_NewSupp
0.3292
-0.1512
0.1365
0.4548
var13
B6_Innov_CustDem
0.2876
-0.2223
0.2438
0.4821
PCA was conducted with rotation to ensure that the extracted components were uncorrelated and interpretable (Westra et al. 2010). Varimax and Promax rotations were applied to improve the interpretability of the components. The rotated components are correlated, indicating that the underlying dimensions of innovation adoption are not independent.
The Kaiser-Meyer-Olkin (KMO) measure of sampling adequacy was calculated to assess the appropriateness of PCA (Shrestha 2021). The overall KMO value was 0.85, which indicates that the data is suitable for PCA. The rotated component loadings (using Varimax rotation) with absolute values greater than 0.30 are shown in Table 4.
Proceedings of the conference on Public innovation, develoPment and sustainability | 213
