
Page 34 - State of Biodiversity 2018/19
P. 34
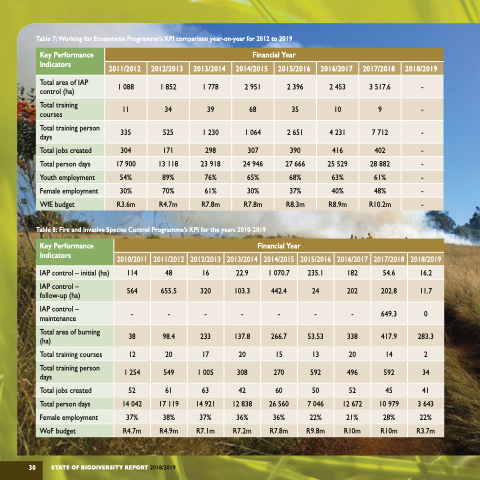
 Table 7: Working for Ecosystems Programme’s KPI comparison year-on-year for 2012 to 2019
 Key Performance Indicators
 Financial Year
2011/2012
  2012/2013
  2013/2014
  2014/2015
  2015/2016
  2016/2017
  2017/2018
  2018/2019
  Total area of IAP control (ha)
 1 088
 1 852
 1 778
 2 951
 2 396
 2 453
 3 517.6
 -
 Total training courses
11
34
39
68
35
10
9
-
 Total training person days
 335
 525
 1 230
 1 064
 2 651
 4 231
 7 712
 -
 Total jobs created
 304
 171
 298
 307
 390
 416
 402
 -
 Total person days
  17 900
  13 118
  23 918
  24 946
  27 666
  25 529
  28 882
  -
 Youth employment
54%
89%
76%
65%
68%
63%
61%
-
 Female employment
 30%
 70%
 61%
 30%
 37%
 40%
 48%
 -
 WfE budget
 R3.6m
 R4.7m
 R7.8m
 R7.8m
 R8.3m
 R8.9m
 R10.2m
 -
      Table 8: Fire and Invasive Species Control Programme’s KPI for the years 2010-2019
 Key Performance Indicators
 Financial Year
 2010/2011
 2011/2012
 2012/2013
 2013/2014
 2014/2015
 2015/2016
 2016/2017
 2017/2018
 2018/2019
 IAP control – initial (ha)
  114
  48
  16
  22.9
  1 070.7
  235.1
  182
  54.6
  16.2
 IAP control – follow-up (ha)
564
655.5
320
103.3
442.4
24
202
202.8
11.7
 IAP control – maintenance
  -
  -
  -
  -
  -
  -
  -
  649.3
  0
 Total area of burning (ha)
38
98.4
233
137.8
266.7
53.53
338
417.9
283.3
 Total training courses
  12
  20
  17
  20
  15
  13
  20
  14
  2
 Total training person days
1 254
549
1 005
308
270
592
496
592
34
 Total jobs created
 52
 61
 63
 42
 60
 50
 52
 45
 41
 Total person days
  14 042
  17 119
  14 921
  12 838
  26 560
  7 046
  12 672
  10 979
  3 643
 Female employment
37%
38%
37%
36%
36%
22%
21%
28%
22%
 WoF budget
 R4.7m
 R4.9m
 R7.1m
 R7.2m
 R7.8m
 R9.8m
 R10m
 R10m
 R3.7m
     STATE OF BIODIVERSITY REPORT 2018/2019
 30
