
Page 36 - State of Biodiversity 2018/19
P. 36
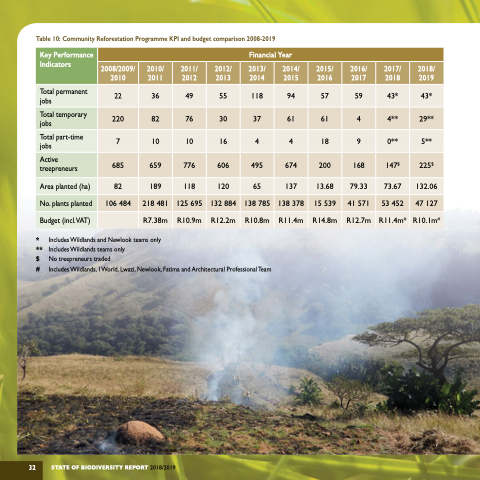
 Table 10: Community Reforestation Programme KPI and budget comparison 2008-2019
 Key Performance Indicators
 Financial Year
 2008/2009/ 2010
 2010/ 2011
 2011/ 2012
 2012/ 2013
 2013/ 2014
 2014/ 2015
 2015/ 2016
 2016/ 2017
 2017/ 2018
 2018/ 2019
 Total permanent jobs
  22
  36
  49
  55
  118
  94
  57
  59
  43*
  43*
 Total temporary jobs
220
82
76
30
37
61
61
4
4**
29**
 Total part-time jobs
  7
  10
  10
  16
  4
  4
  18
  9
  0**
  5**
 Active treepreneurs
 685
 659
  776
606
  495
674
  200
168
 147$
 225$
 Area planted (ha)
  82
  189
  118
  120
  65
  137
  13.68
  79.33
  73.67
  132.06
 No. plants planted
106 484
218 481
125 695
132 884
138 785
138 378
15 539
41 571
53 452
47 127
 Budget (incl.VAT)
  R7.38m
 R10.9m
 R12.2m
 R10.8m
 R11.4m
 R14.8m
 R12.7m
 R11.4m#
 R10.1m#
     * Includes Wildlands and Newlook teams only
** Includes Wildlands teams only
$ No treepreneurs traded
# Includes Wildlands, 1World, Lwazi, Newlook, Fatima and Architectural Professional Team
STATE OF BIODIVERSITY REPORT 2018/2019
 32
