
Page 130 - Cambridge Checkpoint Mathematics Coursebook 7_Slide 02
P. 130
7.1 Simplifying fractions
13 Graphs
A graph is a useful way to show the connection between two Key words
Key words
Key words
variables.
Graphs are a way of showing information as images that are easy to Make sure you learn and
understand these key words:
understand. graph
• How does the price of fuel vary from coordinate grid
one month to the next? axis
• How does the mass of a baby increase with age? origin
• How does the cost of a taxi vary with the distance travelled? x-axis
• How does the cost of a mobile phone vary with the number y-axis
of calls? coordinate
• How does the amount of tax you pay vary with your income? mid-point
• How does your healthy mass vary with your height? equation
• How does the cost of a hotel vary with the length of your stay?
• How does the temperature of water depend on how long you
have been heating it?
• How does the amount of electricity a fridge uses depend on the
temperature inside the fridge?
• How does the output of a solar panel depend on the amount of sunlight?
In all these examples a graph is a good way to show the connection.
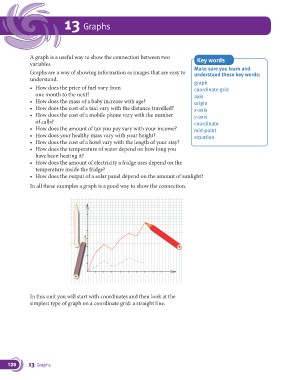
In this unit you will start with coordinates and then look at the
simplest type of graph on a coordinate grid: a straight line.
128 13 Graphs