
Page 126 - STEPS MATHEMATICS 4A
P. 126
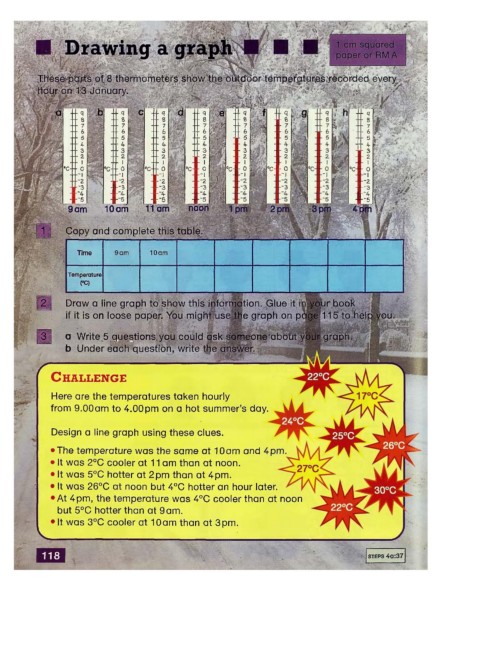
Drawing a graph


       These parts of 8 thermometers show the outdoor temperatures reobrded every
       hour on  13 January.                                ^                      ;    :   .-.'/.•'


                  q        -  q  c   -  q  d   •  q  e   -  q  f
                                                         -  8
                  8                  -  8
                  7        -  7      -  7      -  7     -  -  7
                                               -  6
                           -  6
                  6                  -  6               -  -  6
                  5        -  5      -  5      -  5     -  -  5
                  4        -  4      -  4      -  4     -  -  4
                  3        -  3      -  3      -  3     -  -  3
                  2        -  2      -  2       2       -  -  2
                  I        -  I      -  I      -  I     _   -   |
               ...j3    °c- -  0  °c- -  0  °c- -  0   'C-  -  0
                 -2        --2       --2       --2
               *-2         --3       -~3       -~5
                                               --3
               ----5
                           •"4
                                               •"4
                                     -~4
                           •-5
                                     --5
               9am      10am      11 am      noon
              Copy and complete this table.
                 Time     Gam      10am
               Temperature
                  (°C)

              Draw a  line graph to show this inforr||ftion. Glue it inly^our book        ||
              if it is on  loose paper. You  might useflfe graph on  pQpell 15 to help you.

              a  Write.5 questions you could ask someone about your graph.
              b  Under each question, write the answer.


          CHALLENGE


          Here are the temperatures taken hourly
          from 9.00am to 4.00pm on a  hot summer's day.


          Design a  line graph using these clues.

          • The temperature was the same at 10am and
          • It was 2°C cooler at 11 am than at noon.
          • It was 5°C hotter at 2pm than at 4pm.
          • It was 26°C at noon  but 4°C hotter an  hour later.
          •At 4pm, the temperature was 4°C cooler than at noon
            but 5°C hotter than at 9am.
          • It was 3°C cooler at 10am than at 3pm.