Page 12 - 6550_Agilent_2020-DEI-Report_V07
P. 12

Leadership Breakdown


                                                                                                                                                                                                      Global Gender                                Race & Ethnicity in the
                                                                                                                                                                                                      Diversity                                    United States
         Representation by gender                                                                                                                                                                                                                                                                          Color Key


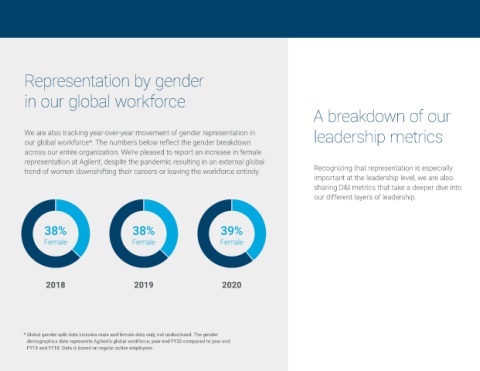
         in our global workforce                                                                                                                                                                                                          78.57%                                                           n White

                                                                                                                                                                                                                                          14.29%
                                                                                                        A breakdown of our                                           CEO Staff &                          21.4%                              7.4%                                                          n Asian


         We are also tracking year-over-year movement of gender representation in                        leadership metrics                                         Officers                               Female                             0%                                                           n Hispanic
         our global workforce*. The numbers below reflect the gender breakdown                                                                                                                                                                0%                                                           n Black
         across our entire organization. We’re pleased to report an increase in female                                                                                                                                                                                                                     n Other Race
         representation at Agilent, despite the pandemic resulting in an external global                                                                                                                                                  80.49%
         trend of women downshifting their careers or leaving the workforce entirely.                    Recognizing that representation is especially                                                                                     9.76%
                                                                                                         important at the leadership level, we are also                                                   23.4%
                                                                                                         sharing D&I metrics that take a deeper dive into           Vice President                                                         7.32%
                                                                                                         our different layers of leadership.                                                               Female                          2.44%
                                                                                                                                                                                                                                              0%


                38%                          38%                          39%                                                                                                                                                             81.88%

                Female                       Female                       Female                                                                                                                                                          13.77%
                                                                                                                                                                    Associate Vice                        30.6%                            1.45%
                                                                                                                                                                     President                             Female
                                                                                                                                                                                                                                           1.45%
                                                                                                                                                                                                                                           1.45%
                2018                         2019                         2020
                                                                                                                                                                                                                                          75.32%

                                                                                                                                                                                                                                          17.32%
                                                                                                                                                                     Director                             26.4%                             3.9%
                                                                                                                                                                                                           Female
         *  Global gender split data includes male and female data only, not undisclosed. The gender                                                                                                                                       3.03%
          demographics data represents Agilent’s global workforce, year-end FY20 compared to year-end
          FY19 and FY18. Data is based on regular active employees.                                                                                                                                                                        0.43%
   7   8   9   10   11   12   13   14   15   16