
Page 59 - NEW FOREX FULL COURSE
P. 59
FOREX TRADING COURSE FOR BEGINNERS
commodities can be measured on the same scale for comparison to each other and to
previous highs and lows within the same commodity.
4. The problem of having to keep up with mountains of previous data is also solved. After
calculating the initial RSI, only the previous day's data is required for the next calculation.
JUST ONE TOOL
The Relative Strength Index, used in conjunction with a bar chart, can provide a new dimension
of interpretation for the chart reader. No single tool, method, or system is going to produce the
right answers 100 of the time. However, the RSI can be a valuable input into this decision making
process.
Commodity Price Charts plots the 14-day RSI, updating the chart through Thursday of each week.
Contrary to popular opinion, the choice of the number of market days used in calculating the RSI
doesn't really matter because the smoothing nature of the exponential averages reduces the
effect of the early days as more data is included.
To help you update the RSI values until the next issue of the charts arrives, we list the "up
average" and "down average" as of Thursday on each RSI chart.
SIMPLIFIED FORMULA
The procedure outlined earlier for beginning and updating RSIs is from J. Welles Wilder's book
and his 1978 Futures Magazine story, which made the RSI a popular technical tool. The
following is a simpler and faster method of computing the RSI. The results are the same as
Wilder's more complicated method.
To begin a new RSI, just list the changes for 14 consecutive trading days and total the changes.
Divide these totals by 14, and you will have the new up and down average. Then proceed with
this formula:
RSI = 100 x (U / U + D)
U = up average; D = down average.
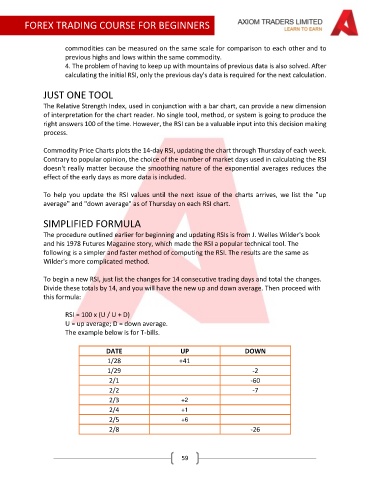
The example below is for T-bills.
DATE UP DOWN
1/28 +41
1/29 -2
2/1 -60
2/2 -7
2/3 +2
2/4 +1
2/5 +6
2/8 -26
59