
Page 23 - 2018 Annual Report
P. 23
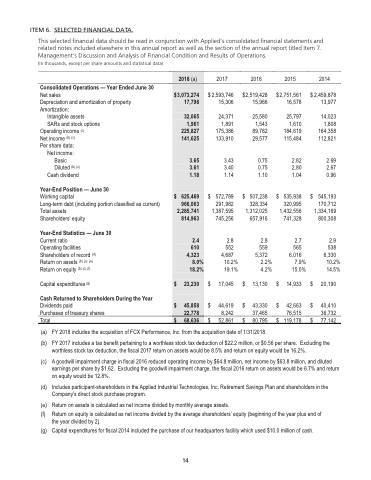
                 Table of Contents
 ITEM 6. SELECTED FINANCIAL DATA.
This selected financial data should be read in conjunction with Applied's consolidated financial statements and related notes included elsewhere in this annual report as well as the section of the annual report titled Item 7. Management's Discussion and Analysis of Financial Condition and Results of Operations.
(In thousands, except per share amounts and statistical data)
    2018 (a)
 $ 3,073,274 17,798
32,065 1,961 225,827 141,625
3.65 3.61 1.18
$ 625,469 966,063 2,285,741 814,963
2.4 610 4,323
8.0% 18.2%
23,230
45,858 22,778
$ $
$ 68,636
          2014
2,459,878 13,977
14,023 1,808 164,358 112,821
2.69 2.67 0.96
545,193
170,712 1,334,169 800,308
2.9 538 6,330
10.2% 14.5%
20,190
40,410 36,732 77,142
(b) FY 2017 includes a tax benefit pertaining to a worthless stock tax deduction of $22.2 million, or $0.56 per share. Excluding the worthless stock tax deduction, the fiscal 2017 return on assets would be 8.5% and return on equity would be 16.2%.
(c) A goodwill impairment charge in fiscal 2016 reduced operating income by $64.8 million, net income by $63.8 million, and diluted earnings per share by $1.62. Excluding the goodwill impairment charge, the fiscal 2016 return on assets would be 6.7% and return on equity would be 12.8%.
(d) Includes participant-shareholders in the Applied Industrial Technologies, Inc. Retirement Savings Plan and shareholders in the Company's direct stock purchase program.
(e) Return on assets is calculated as net income divided by monthly average assets.
(f) Return on equity is calculated as net income divided by the average shareholders’ equity (beginning of the year plus end of the year divided by 2).
(g) Capital expenditures for fiscal 2014 included the purchase of our headquarters facility which used $10.0 million of cash.
Consolidated Operations — Year Ended June 30
Net sales
Depreciation and amortization of property Amortization:
Intangible assets
SARs and stock options Operating income (c)
Net income (b) (c)
Per share data:
Net income: Basic
Diluted (b) (c) Cash dividend
Year-End Position — June 30
Working capital
Long-term debt (including portion classified as current) Total assets
Shareholders’ equity
Year-End Statistics — June 30
Current ratio
Operating facilities Shareholders of record (d) Return on assets (b) (c) (e) Return on equity (b) (c) (f)
Capital expenditures (g)
Cash Returned to Shareholders During the Year
$
$
2017
2,593,746 15,306
24,371 1,891 175,386 133,910
3.43 3.40 1.14
572,789
291,982 1,387,595 745,256
2.8 552 4,687
10.2% 19.1%
17,045
44,619 8,242
2016 2015
$ 2,519,428 $ 2,751,561 15,966 16,578
25,580 25,797 1,543 1,610 89,782 184,619 29,577 115,484
0.75 2.82 0.75 2.80 1.10 1.04
$ 507,238 $ 535,938 328,334 320,995 1,312,025 1,432,556 657,916 741,328
          Dividends paid
Purchases of treasury shares
Total                   $
52,861         $
(a) FY 2018 includes the acquisition of FCX Performance, Inc. from the acquisition date of 1/31/2018.
$
$
$
$
$
2.8 2.7 559 565 5,372 6,016
2.2% 7.9% 4.2% 15.0%
13,130 $ 14,933
$
$
43,330 $ 42,663 37,465 76,515 80,795         $ 119,178         $
$
14
 14
