
Page 25 - 2018 Annual Report
P. 25
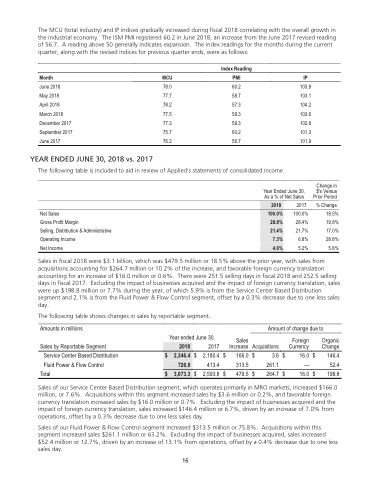
                 Table of Contents
 The MCU (total industry) and IP indices gradually increased during fiscal 2018 correlating with the overall growth in the industrial economy. The ISM PMI registered 60.2 in June 2018, an increase from the June 2017 revised reading of 56.7. A reading above 50 generally indicates expansion. The index readings for the months during the current quarter, along with the revised indices for previous quarter ends, were as follows:
    Index Reading Month MCU PMI
IP
103.9 103.1 104.2 103.6 102.8 101.3 101.9
            June 2018
May 2018
April 2018 March 2018 December 2017 September 2017 June 2017
YEAR ENDED JUNE 30, 2018 vs. 2017
78.0 60.2 77.7 58.7 78.2 57.3 77.5 59.3 77.3 59.3 75.7 60.2 76.2 56.7
 The following table is included to aid in review of Applied’s statements of consolidated income.
 Year Ended June 30, As a % of Net Sales
2017 Net Sales 100.0% Gross Profit Margin 28.4% Selling, Distribution & Administrative 21.7% Operating Income 6.8% Net Income 5.2%
Change in
$'s Versus Prior Period
 2018
  100.0% 28.8% 21.4%
7.3% 4.6%
  % Change 18.5% 19.8% 17.0% 28.8% 5.8%
     Sales in fiscal 2018 were $3.1 billion, which was $479.5 million or 18.5% above the prior year, with sales from acquisitions accounting for $264.7 million or 10.2% of the increase, and favorable foreign currency translation accounting for an increase of $16.0 million or 0.6%. There were 251.5 selling days in fiscal 2018 and 252.5 selling days in fiscal 2017. Excluding the impact of businesses acquired and the impact of foreign currency translation, sales were up $198.8 million or 7.7% during the year, of which 5.9% is from the Service Center Based Distribution segment and 2.1% is from the Fluid Power & Flow Control segment, offset by a 0.3% decrease due to one less sales day.
The following table shows changes in sales by reportable segment.
Amounts in millions
Sales by Reportable Segment Service Center Based Distribution Fluid Power & Flow Control
Total
Amount of change due to
   Year ended June 30, 2017
Sales
Increase Acquisitions
Foreign Currency
16.0 $ — 16.0 $
Organic Change
146.4 52.4 198.8
   2018
 $ 2,346.4 726.9
$ 3,073.3
     $
2,180.4 413.4
$
166.0 313.5 479.5
$
$
3.6 $ 261.1
264.7 $
     $ 2,593.8 $
      Sales of our Service Center Based Distribution segment, which operates primarily in MRO markets, increased $166.0 million, or 7.6%. Acquisitions within this segment increased sales by $3.6 million or 0.2%, and favorable foreign currency translation increased sales by $16.0 million or 0.7%. Excluding the impact of businesses acquired and the impact of foreign currency translation, sales increased $146.4 million or 6.7%, driven by an increase of 7.0% from operations, offset by a 0.3% decrease due to one less sales day.
Sales of our Fluid Power & Flow Control segment increased $313.5 million or 75.8%. Acquisitions within this segment increased sales $261.1 million or 63.2%. Excluding the impact of businesses acquired, sales increased $52.4 million or 12.7%, driven by an increase of 13.1% from operations, offset by a 0.4% decrease due to one less sales day.
16
 16
