
Page 26 - 2018 Annual Report
P. 26
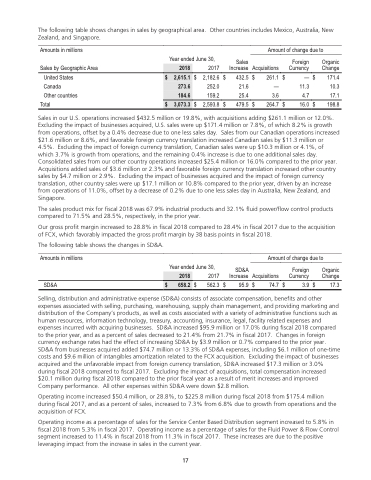
                 Table of Contents
 The following table shows changes in sales by geographical area. Other countries includes Mexico, Australia, New Zealand, and Singapore.
Amounts in millions
Sales by Geographic Area
United States     $ Canada
Other countries
Total
Amount of change due to
   Year ended June 30, 2017
Sales
Increase Acquisitions
Foreign Currency
Organic Change
171.4 10.3 17.1 198.8
   2018
$ 2,615.1 273.6 184.6
$ 3,073.3
    2,182.6 252.0 159.2 $ 2,593.8
$
$
432.5 $ 21.6
25.4 479.5 $
261.1 $ — $ — 11.3 3.6 4.7 264.7 $ 16.0 $
           Sales in our U.S. operations increased $432.5 million or 19.8%, with acquisitions adding $261.1 million or 12.0%. Excluding the impact of businesses acquired, U.S. sales were up $171.4 million or 7.8%, of which 8.2% is growth from operations, offset by a 0.4% decrease due to one less sales day. Sales from our Canadian operations increased $21.6 million or 8.6%, and favorable foreign currency translation increased Canadian sales by $11.3 million or 4.5%. Excluding the impact of foreign currency translation, Canadian sales were up $10.3 million or 4.1%, of which 3.7% is growth from operations, and the remaining 0.4% increase is due to one additional sales day. Consolidated sales from our other country operations increased $25.4 million or 16.0% compared to the prior year. Acquisitions added sales of $3.6 million or 2.3% and favorable foreign currency translation increased other country sales by $4.7 million or 2.9%. Excluding the impact of businesses acquired and the impact of foreign currency translation, other country sales were up $17.1 million or 10.8% compared to the prior year, driven by an increase from operations of 11.0%, offset by a decrease of 0.2% due to one less sales day in Australia, New Zealand, and Singapore.
The sales product mix for fiscal 2018 was 67.9% industrial products and 32.1% fluid power/flow control products compared to 71.5% and 28.5%, respectively, in the prior year.
Our gross profit margin increased to 28.8% in fiscal 2018 compared to 28.4% in fiscal 2017 due to the acquisition of FCX, which favorably impacted the gross profit margin by 38 basis points in fiscal 2018.
The following table shows the changes in SD&A.
Amounts in millions
SD&A
Amount of change due to
   Year ended June 30, 2017
$ 562.3 $
SD&A
Increase Acquisitions
95.9 $ 74.7 $
Foreign Currency
3.9 $
Organic Change
17.3
   2018
 $ 658.2
      Selling, distribution and administrative expense (SD&A) consists of associate compensation, benefits and other expenses associated with selling, purchasing, warehousing, supply chain management, and providing marketing and distribution of the Company’s products, as well as costs associated with a variety of administrative functions such as human resources, information technology, treasury, accounting, insurance, legal, facility related expenses and expenses incurred with acquiring businesses. SD&A increased $95.9 million or 17.0% during fiscal 2018 compared to the prior year, and as a percent of sales decreased to 21.4% from 21.7% in fiscal 2017. Changes in foreign currency exchange rates had the effect of increasing SD&A by $3.9 million or 0.7% compared to the prior year. SD&A from businesses acquired added $74.7 million or 13.3% of SD&A expenses, including $6.1 million of one-time costs and $9.6 million of intangibles amortization related to the FCX acquisition. Excluding the impact of businesses acquired and the unfavorable impact from foreign currency translation, SD&A increased $17.3 million or 3.0% during fiscal 2018 compared to fiscal 2017. Excluding the impact of acquisitions, total compensation increased $20.1 million during fiscal 2018 compared to the prior fiscal year as a result of merit increases and improved Company performance. All other expenses within SD&A were down $2.8 million.
Operating income increased $50.4 million, or 28.8%, to $225.8 million during fiscal 2018 from $175.4 million during fiscal 2017, and as a percent of sales, increased to 7.3% from 6.8% due to growth from operations and the acquisition of FCX.
Operating income as a percentage of sales for the Service Center Based Distribution segment increased to 5.8% in fiscal 2018 from 5.3% in fiscal 2017. Operating income as a percentage of sales for the Fluid Power & Flow Control segment increased to 11.4% in fiscal 2018 from 11.3% in fiscal 2017. These increases are due to the positive leveraging impact from the increase in sales in the current year.
17
17
