
Page 28 - 2018 Annual Report
P. 28
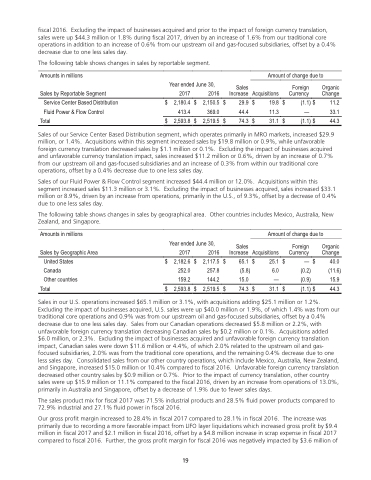
                 Table of Contents
 fiscal 2016. Excluding the impact of businesses acquired and prior to the impact of foreign currency translation, sales were up $44.3 million or 1.8% during fiscal 2017, driven by an increase of 1.6% from our traditional core operations in addition to an increase of 0.6% from our upstream oil and gas-focused subsidiaries, offset by a 0.4% decrease due to one less sales day.
The following table shows changes in sales by reportable segment.
Amounts in millions
Sales by Reportable Segment Service Center Based Distribution Fluid Power & Flow Control
Total
Amount of change due to
   Year ended June 30,
Sales
Increase Acquisitions
   2017 2,180.4 413.4 $ 2,593.8
2016 $ 2,150.5 369.0 $ 2,519.5
Organic Change
Foreign Currency
19.8 $
11.3 — 33.1 31.1 $   (1.1) $ 44.3
 $
$ 29.9$ 44.4
$ 74.3$
(1.1) $
11.2
            Sales of our Service Center Based Distribution segment, which operates primarily in MRO markets, increased $29.9 million, or 1.4%. Acquisitions within this segment increased sales by $19.8 million or 0.9%, while unfavorable foreign currency translation decreased sales by $1.1 million or 0.1%. Excluding the impact of businesses acquired and unfavorable currency translation impact, sales increased $11.2 million or 0.6%, driven by an increase of 0.7% from our upstream oil and gas-focused subsidiaries and an increase of 0.3% from within our traditional core operations, offset by a 0.4% decrease due to one less sales day.
Sales of our Fluid Power & Flow Control segment increased $44.4 million or 12.0%. Acquisitions within this segment increased sales $11.3 million or 3.1%. Excluding the impact of businesses acquired, sales increased $33.1 million or 8.9%, driven by an increase from operations, primarily in the U.S., of 9.3%, offset by a decrease of 0.4% due to one less sales day.
The following table shows changes in sales by geographical area. Other countries includes Mexico, Australia, New Zealand, and Singapore.
Amounts in millions
Sales by Geographic Area
UnitedStates
Canada 252.0 Other countries 159.2
Total $ 2,593.8
Amount of change due to
   Year ended June 30,
Sales
Increase Acquisitions
65.1 $ 25.1 (5.8) 6.0 15.0 — 74.3 $ 31.1
Foreign Organic Currency Change
— $ 40.0 (0.2) (11.6) (0.9) 15.9 (1.1) $ 44.3
   2017 $ 2,182.6
2016
$ 2,117.5 $
257.8
144.2
$ 2,519.5 $
$ $
              Sales in our U.S. operations increased $65.1 million or 3.1%, with acquisitions adding $25.1 million or 1.2%. Excluding the impact of businesses acquired, U.S. sales were up $40.0 million or 1.9%, of which 1.4% was from our traditional core operations and 0.9% was from our upstream oil and gas-focused subsidiaries, offset by a 0.4% decrease due to one less sales day. Sales from our Canadian operations decreased $5.8 million or 2.2%, with unfavorable foreign currency translation decreasing Canadian sales by $0.2 million or 0.1%. Acquisitions added $6.0 million, or 2.3%. Excluding the impact of businesses acquired and unfavorable foreign currency translation impact, Canadian sales were down $11.6 million or 4.4%, of which 2.0% related to the upstream oil and gas- focused subsidiaries, 2.0% was from the traditional core operations, and the remaining 0.4% decrease due to one less sales day. Consolidated sales from our other country operations, which include Mexico, Australia, New Zealand, and Singapore, increased $15.0 million or 10.4% compared to fiscal 2016. Unfavorable foreign currency translation decreased other country sales by $0.9 million or 0.7%. Prior to the impact of currency translation, other country sales were up $15.9 million or 11.1% compared to the fiscal 2016, driven by an increase from operations of 13.0%, primarily in Australia and Singapore, offset by a decrease of 1.9% due to fewer sales days.
The sales product mix for fiscal 2017 was 71.5% industrial products and 28.5% fluid power products compared to 72.9% industrial and 27.1% fluid power in fiscal 2016.
Our gross profit margin increased to 28.4% in fiscal 2017 compared to 28.1% in fiscal 2016. The increase was primarily due to recording a more favorable impact from LIFO layer liquidations which increased gross profit by $9.4 million in fiscal 2017 and $2.1 million in fiscal 2016, offset by a $4.8 million increase in scrap expense in fiscal 2017 compared to fiscal 2016. Further, the gross profit margin for fiscal 2016 was negatively impacted by $3.6 million of
19
19
