
Page 30 - 2018 Annual Report
P. 30
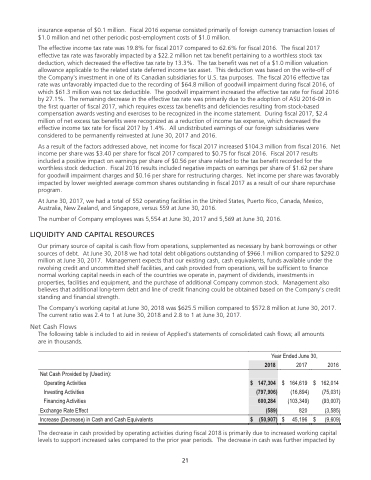
                 Table of Contents
 insurance expense of $0.1 million. Fiscal 2016 expense consisted primarily of foreign currency transaction losses of $1.0 million and net other periodic post-employment costs of $1.0 million.
The effective income tax rate was 19.8% for fiscal 2017 compared to 62.6% for fiscal 2016. The fiscal 2017 effective tax rate was favorably impacted by a $22.2 million net tax benefit pertaining to a worthless stock tax deduction, which decreased the effective tax rate by 13.3%. The tax benefit was net of a $1.0 million valuation allowance applicable to the related state deferred income tax asset. This deduction was based on the write-off of the Company's investment in one of its Canadian subsidiaries for U.S. tax purposes. The fiscal 2016 effective tax rate was unfavorably impacted due to the recording of $64.8 million of goodwill impairment during fiscal 2016, of which $61.3 million was not tax deductible. The goodwill impairment increased the effective tax rate for fiscal 2016 by 27.1%. The remaining decrease in the effective tax rate was primarily due to the adoption of ASU 2016-09 in the first quarter of fiscal 2017, which requires excess tax benefits and deficiencies resulting from stock-based compensation awards vesting and exercises to be recognized in the income statement. During fiscal 2017, $2.4 million of net excess tax benefits were recognized as a reduction of income tax expense, which decreased the effective income tax rate for fiscal 2017 by 1.4%. All undistributed earnings of our foreign subsidiaries were considered to be permanently reinvested at June 30, 2017 and 2016.
As a result of the factors addressed above, net income for fiscal 2017 increased $104.3 million from fiscal 2016. Net income per share was $3.40 per share for fiscal 2017 compared to $0.75 for fiscal 2016. Fiscal 2017 results included a positive impact on earnings per share of $0.56 per share related to the tax benefit recorded for the worthless stock deduction. Fiscal 2016 results included negative impacts on earnings per share of $1.62 per share for goodwill impairment charges and $0.16 per share for restructuring charges. Net income per share was favorably impacted by lower weighted average common shares outstanding in fiscal 2017 as a result of our share repurchase program.
At June 30, 2017, we had a total of 552 operating facilities in the United States, Puerto Rico, Canada, Mexico, Australia, New Zealand, and Singapore, versus 559 at June 30, 2016.
The number of Company employees was 5,554 at June 30, 2017 and 5,569 at June 30, 2016.
LIQUIDITY AND CAPITAL RESOURCES
Our primary source of capital is cash flow from operations, supplemented as necessary by bank borrowings or other sources of debt. At June 30, 2018 we had total debt obligations outstanding of $966.1 million compared to $292.0 million at June 30, 2017. Management expects that our existing cash, cash equivalents, funds available under the revolving credit and uncommitted shelf facilities, and cash provided from operations, will be sufficient to finance normal working capital needs in each of the countries we operate in, payment of dividends, investments in properties, facilities and equipment, and the purchase of additional Company common stock. Management also believes that additional long-term debt and line of credit financing could be obtained based on the Company’s credit standing and financial strength.
The Company’s working capital at June 30, 2018 was $625.5 million compared to $572.8 million at June 30, 2017. The current ratio was 2.4 to 1 at June 30, 2018 and 2.8 to 1 at June 30, 2017.
Net Cash Flows
The following table is included to aid in review of Applied’s statements of consolidated cash flows; all amounts are in thousands.
Year Ended June 30, 2017
2016
162,014 (75,031) (93,007)
(3,585) (9,609)
  2018
 $ 147,304 (797,906)
600,284 (589)
$ (50,907)
  Net Cash Provided by (Used in): Operating Activities
Investing Activities
Financing Activities
$
164,619 (16,894) (103,349)
$
  Exchange Rate Effect
Increase (Decrease) in Cash and Cash Equivalents         $
820 45,196     $
     The decrease in cash provided by operating activities during fiscal 2018 is primarily due to increased working capital levels to support increased sales compared to the prior year periods. The decrease in cash was further impacted by
21
21
