
Page 39 - 2018 Annual Report
P. 39
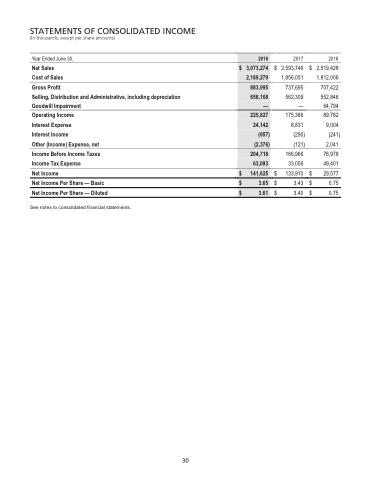
                 Table of Contents
 STATEMENTS OF CONSOLIDATED INCOME
(In thousands, except per share amounts)
Year Ended June 30,
Net Sales Cost of Sales
Gross Profit
Selling, Distribution and Administrative, including depreciation Goodwill Impairment
Operating Income
Interest Expense
Interest Income
Other (Income) Expense, net
Income Before Income Taxes Income Tax Expense
Net Income
Net Income Per Share — Basic Net Income Per Share — Diluted
See notes to consolidated financial statements.
$
2017 2,593,746 1,856,051
737,695 562,309 —
175,386 8,831
(290) (121)
166,966 33,056
133,910
3.43 3.40
2016 $ 2,519,428 1,812,006
707,422 552,846 64,794
89,782 9,004
(241) 2,041
78,978 49,401
29,577
0.75 0.75
   2018
 $ 3,073,274 2,189,279
 883,995
658,168 —
 225,827 24,142
(657) (2,376)
 204,718 63,093
 $ 141,625
 $ 3.65
 $ 3.61
                     $
$ $
$
$ $
              30
30
