
Page 41 - 2018 Annual Report
P. 41
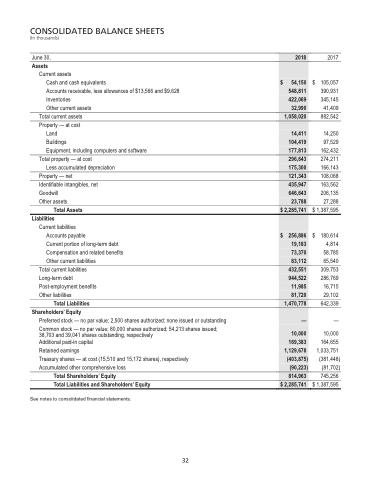
                 Table of Contents
 CONSOLIDATED BALANCE SHEETS
(In thousands)
June 30,
Assets
Current assets
Cash and cash equivalents
Accounts receivable, less allowances of $13,566 and $9,628 Inventories
Other current assets
Total current assets Property — at cost
Land
Buildings
Equipment, including computers and software
Total property — at cost
Less accumulated depreciation
Property — net
Identifiable intangibles, net Goodwill
Other assets
Total Assets Liabilities
Current liabilities
Accounts payable
Current portion of long-term debt Compensation and related benefits Other current liabilities
Total current liabilities Long-term debt Post-employment benefits Other liabilities
Total Liabilities Shareholders’ Equity
Preferred stock — no par value; 2,500 shares authorized; none issued or outstanding
Common stock — no par value; 80,000 shares authorized; 54,213 shares issued; 38,703 and 39,041 shares outstanding, respectively
Additional paid-in capital
Retained earnings
Treasury shares — at cost (15,510 and 15,172 shares), respectively Accumulated other comprehensive loss
Total Shareholders’ Equity
Total Liabilities and Shareholders’ Equity
See notes to consolidated financial statements.
2017
105,057 390,931 345,145
41,409 882,542
14,250
97,529 162,432 274,211 166,143 108,068 163,562 206,135
27,288 $ 1,387,595
  2018
  $ 54,150 548,811 422,069 32,990
1,058,020
  14,411 104,419 177,813
296,643 175,300
 121,343
  435,947 646,643 23,788
$ 2,285,741
  $ 256,886 19,183 73,370 83,112
432,551 944,522 11,985 81,720
 1,470,778
  —
10,000 169,383 1,129,678
(403,875) (90,223)
814,963
  $ 2,285,741
        $
                       $
180,614 4,814 58,785 65,540 309,753 286,769 16,715 29,102 642,339
—
10,000 164,655 1,033,751
(381,448) (81,702)
           745,256 $ 1,387,595
           32
32
