
Page 42 - 2018 Annual Report
P. 42
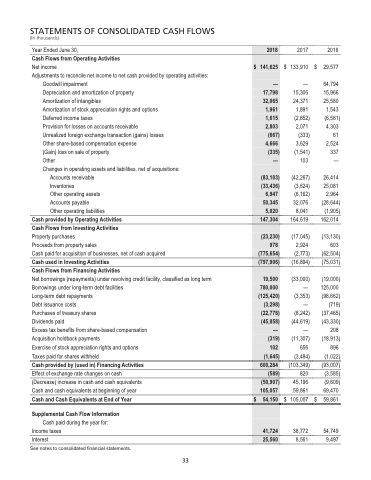
                 Table of Contents
 STATEMENTS OF CONSOLIDATED CASH FLOWS
(In thousands)
Year Ended June 30,
Cash Flows from Operating Activities
Net income
Adjustments to reconcile net income to net cash provided by operating activities:
Goodwill impairment
Depreciation and amortization of property
Amortization of intangibles
Amortization of stock appreciation rights and options
Deferred income taxes
Provision for losses on accounts receivable
Unrealized foreign exchange transaction (gains) losses
Other share-based compensation expense
(Gain) loss on sale of property
Other
Changes in operating assets and liabilities, net of acquisitions:
$
2017 133,910
— 15,306 24,371 1,891
(2,852) 2,071
(333) 3,629
(1,541) 103
2016
29,577
64,794 15,966 25,580
1,543 (6,581) 4,303
61 2,524 337 —
26,414 25,081 2,964
(28,644) (1,905)
162,014
(13,130) 603
(62,504) (75,031)
(19,000) 125,000
(98,662) (719) (37,465) (43,330)
208 (18,913)
896 (1,022) (93,007) (3,585) (9,609)
69,470 $ 59,861
54,749 9,497
  2018
  $ 141,625
— 17,798 32,065 1,961 1,615 2,803
(667) 4,666
(335) —
(83,103) (33,436)
6,947 50,345 5,020
147,304
  (23,230) 978
(775,654)
(797,906)
  19,500 780,000
(125,420) (3,298) (22,778) (45,858)
— (319)
102 (1,645)
600,284
 (589)
  (50,907) 105,057
$ 54,150
 41,724
25,560
             Accounts receivable
Inventories (3,624)
Other operating assets Accounts payable
Other operating liabilities
Cash provided by Operating Activities Cash Flows from Investing Activities Property purchases
Proceeds from property sales
Cash paid for acquisition of businesses, net of cash acquired
Cash used in Investing Activities
Cash Flows from Financing Activities
Net borrowings (repayments) under revolving credit facility, classified as long term
Borrowings under long-term debt facilities
Long-term debt repayments
Debt issuance costs
Purchases of treasury shares
Dividends paid
Excess tax benefits from share-based compensation
Acquisition holdback payments
Exercise of stock appreciation rights and options
Taxes paid for shares withheld
Cash provided by (used in) Financing Activities
Effect of exchange rate changes on cash
(Decrease) increase in cash and cash equivalents
Cash and cash equivalents at beginning of year
Cash and Cash Equivalents at End of Year       $
Supplemental Cash Flow Information
Cash paid during the year for: Income taxes
(6,162) 32,076 8,041 164,619
(17,045) 2,924
(2,773) (16,894)
(33,000) —
(3,353) —
(8,242) (44,619)
— (11,307)
656 (3,484) (103,349)
820 45,196 59,861 105,057
(42,267)
$
                                              38,772 Interest 8,561
      See notes to consolidated financial statements.
33
33
