
Page 43 - 2018 Annual Report
P. 43
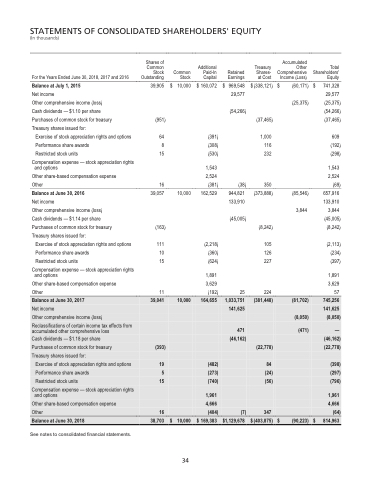
                 Table of Contents
 STATEMENTS OF CONSOLIDATED SHAREHOLDERS' EQUITY
(In thousands)
For the Years Ended June 30, 2018, 2017 and 2016
Balance at July 1, 2015
Shares of Common Stock Outstanding
39,905
Additional Paid-In Capital
Treasury Shares- at Cost
Accumulated Other Comprehensive Income (Loss)
 Net income
Other comprehensive income (loss)
Cash dividends — $1.10 per share
Purchases of common stock for treasury (951) Treasury shares issued for:
Exercise of stock appreciation rights and options 64 Performance share awards 8 Restricted stock units 15
Compensation expense — stock appreciation rights and options
Other share-based compensation expense
Other 16 Balance at June 30, 2016 39,057 Net income
Other comprehensive income (loss)
Cash dividends — $1.14 per share
Purchases of common stock for treasury (163) Treasury shares issued for:
Exercise of stock appreciation rights and options 111 Performance share awards 10 Restricted stock units 15
Compensation expense — stock appreciation rights and options
Other share-based compensation expense Other
$ 10,000 $ 160,072 $ 969,548 $ (338,121) $ 29,577
Common Stock
Retained Earnings
Total Shareholders' Equity
(60,171) $ 741,328 29,577
 (391) (308) (530)
1,543 2,524
(381) 162,529
(2,218) (360) (624)
1,891
3,629 11 (192)
(54,266)
(38) 944,821 133,910
(45,005)
25
(37,465)
1,000 116 232
350 (373,888)
(8,242)
(85,546) 3,844
(25,375)
(25,375) (54,266) (37,465)
609 (192) (298)
1,543 2,524
(69) 657,916 133,910 3,844
(45,005) (8,242)
 10,000
105 (2,113) 126 (234) 227 (397)
1,891
3,629 224 57
Balance at June 30, 2017
Net income
Other comprehensive income (loss)
Reclassifications of certain income tax effects from accumulated other comprehensive loss
Cash dividends — $1.18 per share Purchases of common stock for treasury Treasury shares issued for:
Exercise of stock appreciation rights and options Performance share awards
Restricted stock units
Compensation expense — stock appreciation rights and options
Other share-based compensation expense Other
 39,041
(393)
19 5 15
16
               10,000
               164,655
(482) (273) (740)
1,961 4,666
(404)
               1,033,751 141,625
471 (46,162)
(7)
               (381,448)
(22,778)
84 (24) (56)
347
               (81,702)
(8,050) (471)
               745,256 141,625
(8,050)
— (46,162) (22,778)
(398) (297) (796)
1,961 4,666
(64)
                Balance at June 30, 2018
  38,703
     $ 10,000
     $ 169,383
     $1,129,678
     $ (403,875)
     $ (90,223)
     $ 814,963
            See notes to consolidated financial statements.
34
34
