
Page 59 - 2018 Annual Report
P. 59
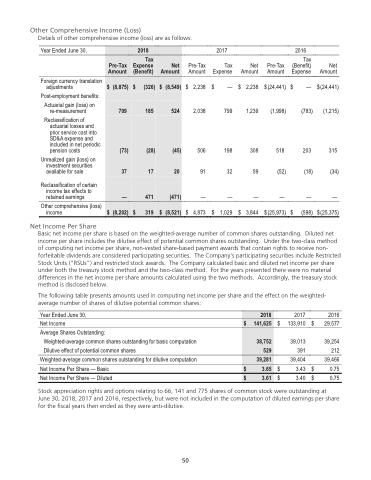
                 Table of Contents
 Other Comprehensive Income (Loss)
Details of other comprehensive income (loss) are as follows:
Year Ended June 30,
Foreign currency translation adjustments
Post-employment benefits:
Actuarial gain (loss) on re-measurement
Reclassification of actuarial losses and prior service cost into SD&A expense and included in net periodic pension costs
Unrealized gain (loss) on investment securities available for sale
Reclassification of certain income tax effects to retained earnings
Other comprehensive (loss) income
Net Income Per Share
2017
Pre-Tax Tax Amount Expense
2,238 $ — 2,038 799
506 198 91 32
— — 4,873 $ 1,029
Net Amount
Pre-Tax Amount
2016
Tax (Benefit) Expense
Net Amount
 2018
     Pre-Tax Amount
  Tax Expense (Benefit)
     Net Amount
   $ (8,875) 709
(73) 37
—
     $ (326) 185
(28) 17
471
 $ (8,549) 524
(45) 20
(471)
        $ (8,202)
   $ 319
    $ (8,521)
                                $
$
2,238 $ (24,441) 1,239 (1,998)
308 518 59 (52)
— — 3,844 $ (25,973)
$
— $ (24,441) (783) (1,215)
203 315 (18) (34)
— — (598) $ (25,375)
             $
$
$
             Basic net income per share is based on the weighted-average number of common shares outstanding. Diluted net income per share includes the dilutive effect of potential common shares outstanding. Under the two-class method of computing net income per share, non-vested share-based payment awards that contain rights to receive non- forfeitable dividends are considered participating securities. The Company’s participating securities include Restricted Stock Units ("RSUs") and restricted stock awards. The Company calculated basic and diluted net income per share under both the treasury stock method and the two-class method. For the years presented there were no material differences in the net income per share amounts calculated using the two methods. Accordingly, the treasury stock method is disclosed below.
The following table presents amounts used in computing net income per share and the effect on the weighted- average number of shares of dilutive potential common shares:
Year Ended June 30, 2017 Net Income $ 133,910       $ Average Shares Outstanding:
Weighted-average common shares outstanding for basic computation 39,013
Dilutive effect of potential common shares 391 Weighted-average common shares outstanding for dilutive computation         39,404 Net Income Per Share — Basic         $ 3.43     $ Net Income Per Share — Diluted         $ 3.40     $
2016 29,577
39,254 212 39,466 0.75 0.75
 2018
  $ 141,625
 38,752 529
39,281
$ 3.65
$ 3.61
                 Stock appreciation rights and options relating to 66, 141 and 775 shares of common stock were outstanding at June 30, 2018, 2017 and 2016, respectively, but were not included in the computation of diluted earnings per share for the fiscal years then ended as they were anti-dilutive.
50
50
