
Page 64 - 2018 Annual Report
P. 64
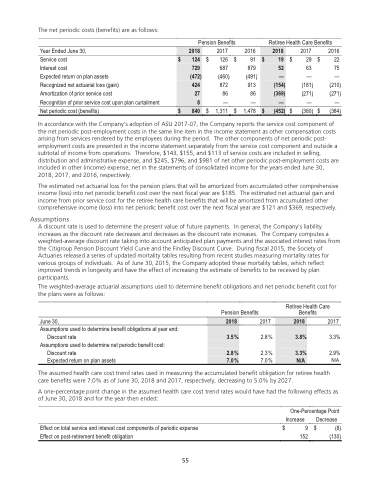
                 Table of Contents
 The net periodic costs (benefits) are as follows:
Pension Benefits
Year Ended June 30,               2017     2016
Retiree Health Care Benefits
 2018
2017       2016
2018
$ 124 729
(472) 424 27 8
$ 126 $ 91 687 879
(460) (491) 872 913 86 86 ——
$ 19 52 —
(154) (369)
—
$ 840
 $ 1,311 $ 1,478
     $ (452)
   Service cost                     $ Interest cost
Expected return on plan assets
Recognized net actuarial loss (gain)
Amortization of prior service cost
Recognition of prior service cost upon plan curtailment
Net periodic cost (benefits)                     $
29     $ 22
63 —
(181) (271)
—
(360)     $ (384)
75 —
(210) (271)
—
     In accordance with the Company's adoption of ASU 2017-07, the Company reports the service cost component of the net periodic post-employment costs in the same line item in the income statement as other compensation costs arising from services rendered by the employees during the period. The other components of net periodic post- employment costs are presented in the income statement separately from the service cost component and outside a subtotal of income from operations. Therefore, $143, $155, and $113 of service costs are included in selling, distribution and administrative expense, and $245, $796, and $981 of net other periodic post-employment costs are included in other (income) expense, net in the statements of consolidated income for the years ended June 30, 2018, 2017, and 2016, respectively.
The estimated net actuarial loss for the pension plans that will be amortized from accumulated other comprehensive income (loss) into net periodic benefit cost over the next fiscal year are $185. The estimated net actuarial gain and income from prior service cost for the retiree health care benefits that will be amortized from accumulated other comprehensive income (loss) into net periodic benefit cost over the next fiscal year are $121 and $369, respectively.
Assumptions
A discount rate is used to determine the present value of future payments. In general, the Company’s liability increases as the discount rate decreases and decreases as the discount rate increases. The Company computes a weighted-average discount rate taking into account anticipated plan payments and the associated interest rates from the Citigroup Pension Discount Yield Curve and the Findley Discount Curve. During fiscal 2015, the Society of Actuaries released a series of updated mortality tables resulting from recent studies measuring mortality rates for various groups of individuals. As of June 30, 2015, the Company adopted these mortality tables, which reflect improved trends in longevity and have the effect of increasing the estimate of benefits to be received by plan participants.
The weighted-average actuarial assumptions used to determine benefit obligations and net periodic benefit cost for the plans were as follows:
  June 30,
Assumptions used to determine benefit obligations at year end:
Discount rate
Assumptions used to determine net periodic benefit cost:
Discount rate
Expected return on plan assets
Pension Benefits
Retiree Health Care Benefits
2017 3.3% 2.9%
N/A
 2018
  2017
      2018
  3.5 %
2.8 % 7.0 %
 2.8 %
2.3 % 7.0 %
 3.8%
3.3% N/A
          The assumed health care cost trend rates used in measuring the accumulated benefit obligation for retiree health care benefits were 7.0% as of June 30, 2018 and 2017, respectively, decreasing to 5.0% by 2027.
A one-percentage point change in the assumed health care cost trend rates would have had the following effects as of June 30, 2018 and for the year then ended:
One-Percentage Point
  Effect on total service and interest cost components of periodic expense Effect on post-retirement benefit obligation
Increase $ 9 152
Decrease $ (8) (130)
    55
55
