
Page 67 - 2018 Annual Report
P. 67
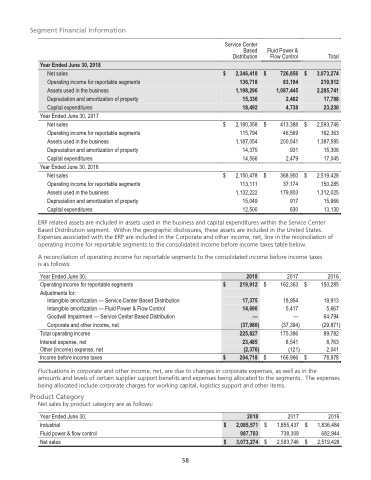
                 Table of Contents
 Segment Financial Information
  Service Center Based Distribution
Fluid Power & Flow Control
413,388     $ 46,569
200,541 931 2,479
368,950     $ 37,174
179,803 917 630
Total
2,593,746 162,363 1,387,595 15,306 17,045
2,519,428 150,285 1,312,025 15,966 13,130
Year Ended June 30, 2018
             Net sales       $ 2,346,418
$ 726,856 83,194 1,087,445 2,462 4,738
       $ 3,073,274 219,912 2,285,741 17,798 23,230
       Operating income for reportable segments 136,718
 Assets used in the business   1,198,296
Depreciation and amortization of property 15,336
 Capital expenditures   18,492
    Year Ended June 30, 2017 Net sales
Operating income for reportable segments Assets used in the business
Depreciation and amortization of property Capital expenditures
Year Ended June 30, 2016 Net sales
Operating income for reportable segments Assets used in the business
Depreciation and amortization of property Capital expenditures
$
$
2,180,358       $ 115,794
1,187,054 14,375 14,566
2,150,478       $ 113,111
1,132,222 15,049 12,500
         ERP related assets are included in assets used in the business and capital expenditures within the Service Center Based Distribution segment. Within the geographic disclosures, these assets are included in the United States. Expenses associated with the ERP are included in the Corporate and other income, net, line in the reconciliation of operating income for reportable segments to the consolidated income before income taxes table below.
A reconciliation of operating income for reportable segments to the consolidated income before income taxes is as follows:
Year Ended June 30,
Operating income for reportable segments         $ Adjustments for:
Intangible amortization — Service Center Based Distribution Intangible amortization — Fluid Power & Flow Control Goodwill Impairment — Service Center Based Distribution Corporate and other income, net
Total operating income
Interest expense, net
Other (income) expense, net
Income before income taxes         $
2017 162,363     $
18,954 5,417 —
(37,394)
175,386 89,782
2016 150,285
19,913 5,667 64,794
 2018
 $ 219,912
17,375 14,690 —
(37,980)
225,827 23,485
(2,376)
 $ 204,718
      (29,871)
  8,541 (121)
166,966 $
8,763
2,041 78,978
       Fluctuations in corporate and other income, net, are due to changes in corporate expenses, as well as in the amounts and levels of certain supplier support benefits and expenses being allocated to the segments. The expenses being allocated include corporate charges for working capital, logistics support and other items.
Product Category
Net sales by product category are as follows:
Year Ended June 30, Industrial
Fluid power & flow control Net sales
$ $
2017 1,855,437 $
738,309 2,593,746 $
2016 1,836,484 682,944 2,519,428
 2018
  $ 2,085,571 987,703
$ 3,073,274
          58
58
