
Page 69 - 2018 Annual Report
P. 69
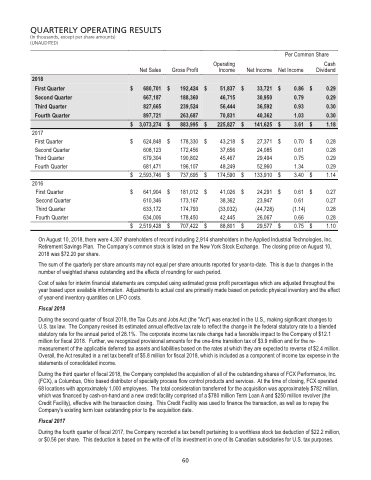
                 Table of Contents
 QUARTERLY OPERATING RESULTS
(In thousands, except per share amounts) (UNAUDITED)
Per Common Share
 Net Sales
$ 624,848 608,123 679,304 681,471
Gross Profit
Operating Income
Net Income
Net Income
Cash Dividend
2018
         $ 192,424 188,360 239,524 263,687
       $ 51,837 46,715 56,444 70,831
       $ 33,721 30,950 36,592 40,362
       $ 0.86 0.79 0.93 1.03
       $ 0.29 0.29 0.30 0.30
First Quarter $ 680,701
 Second Quarter   667,187
Third Quarter   827,665
Fourth Quarter   897,721
$ 3,073,274
   $ 883,995
     $ 225,827
     $ 141,625
     $ 3.61
     $ 1.18
          2017
First Quarter Second Quarter Third Quarter Fourth Quarter
2016
First Quarter Second Quarter Third Quarter Fourth Quarter
$
178,330
172,456
190,802
196,107
737,695     $ 174,590     $ 133,910     $
$ 2,593,746       $
$ 43,218 37,656 45,467 48,249
27,371 24,085 29,494 52,960
$
$
0.70 $ 0.28 0.61 0.28 0.75 0.29 1.34 0.29 3.40 $ 1.14
0.61 $ 0.27
$
$ 24,291 23,947
(44,728) 26,067 29,577 $
               $ 641,904 610,346 633,172 634,006
$
181,012
173,167
174,793
178,450
707,422     $ 88,801     $
$ 2,519,428       $
0.75 $ 1.10
$ 41,026 38,362
0.61 (1.14) 0.66
0.27 0.28 0.28
(33,032) 42,445
                  On August 10, 2018, there were 4,307 shareholders of record including 2,914 shareholders in the Applied Industrial Technologies, Inc. Retirement Savings Plan. The Company’s common stock is listed on the New York Stock Exchange. The closing price on August 10, 2018 was $72.20 per share.
The sum of the quarterly per share amounts may not equal per share amounts reported for year-to-date. This is due to changes in the number of weighted shares outstanding and the effects of rounding for each period.
Cost of sales for interim financial statements are computed using estimated gross profit percentages which are adjusted throughout the year based upon available information. Adjustments to actual cost are primarily made based on periodic physical inventory and the effect of year-end inventory quantities on LIFO costs.
Fiscal 2018
During the second quarter of fiscal 2018, the Tax Cuts and Jobs Act (the "Act") was enacted in the U.S., making significant changes to U.S. tax law. The Company revised its estimated annual effective tax rate to reflect the change in the federal statutory rate to a blended statutory rate for the annual period of 28.1%. The corporate income tax rate change had a favorable impact to the Company of $12.1 million for fiscal 2018. Further, we recognized provisional amounts for the one-time transition tax of $3.9 million and for the re- measurement of the applicable deferred tax assets and liabilities based on the rates at which they are expected to reverse of $2.4 million. Overall, the Act resulted in a net tax benefit of $5.8 million for fiscal 2018, which is included as a component of income tax expense in the statements of consolidated income.
During the third quarter of fiscal 2018, the Company completed the acquisition of all of the outstanding shares of FCX Performance, Inc. (FCX), a Columbus, Ohio based distributor of specialty process flow control products and services. At the time of closing, FCX operated 68 locations with approximately 1,000 employees. The total consideration transferred for the acquisition was approximately $782 million, which was financed by cash-on-hand and a new credit facility comprised of a $780 million Term Loan A and $250 million revolver (the Credit Facility), effective with the transaction closing. This Credit Facility was used to finance the transaction, as well as to repay the Company's existing term loan outstanding prior to the acquisition date.
Fiscal 2017
During the fourth quarter of fiscal 2017, the Company recorded a tax benefit pertaining to a worthless stock tax deduction of $22.2 million, or $0.56 per share. This deduction is based on the write-off of its investment in one of its Canadian subsidiaries for U.S. tax purposes.
60
60
