
Page 16 - Al Bidda TFM Presentation
P. 16
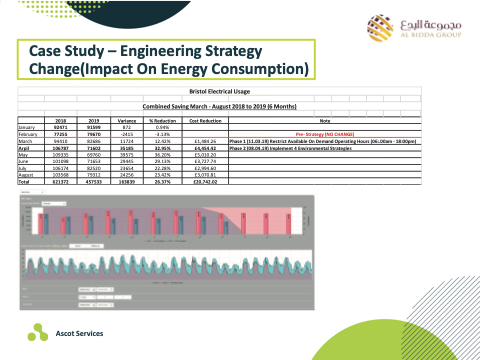
                             January
February
March
Arpil
May
June
July
August
Total
Case Study – Engineering Strategy Change(Impact On Energy Consumption)
                       Months)
         Note
   40% energy
 Pre- Strategy (NO CHANGE)
  estrict Available On Demand Operating Hours (06:.00am - 18:00pm)
mplement 4 Environmental Sctroatnesgiuesmption attributed
  to lights etc.
            2018
92471
77255
94410
106787
109335
101098
106174
103568
621372
2019
91599
79670
82686
71602
69760
71653
82520
79312
457533
Variance
872
-2415
11724
35185
39575
29445
23654
24256
163839
Combined Saving March - August
% Reduction
0.94%
-3.13%
12.42%
32.95%
36.20%
29.13%
22.28%
23.42%
26.37%
Bristol Electrica
                        Cost Reduction
          £1,484.26
£4,454.42
£5,010.20
£3,727.74
£2,994.60
£3,070.81
£20,742.02
l Usage
2018 to 2019 (6
Phase 1 (11.03.19)
Phase 2 (08.04.19) I
R
      Up to 60% of a
building’s energy consumption is generated by the HVAC plant
of which 30% is
attributed to the chillers only (roughly 20% of a building’s total consumption)
   Ascot Services
