Page 26 - IILMGSM Journal_Management Perspective
P. 26
you regress ‘y’ on lagged values of ‘y’ and ‘x’ and manner or the other, or may be having a cause and
the coefficients of the lag of ‘x’ are statistically effect relationship.
significantly different from 0, then you can argue that
‘x’ Granger-cause ‘y’, this is, ‘x’ can be used to Thus to analyse further, the kind of relationship and
predict ‘y’ (Stock & Watson -2007-, Green -2008). to find out which is the cause and which is the effect,
we have performed the Granger Causality test.
Unidirectional causality from Export to GDP is
indicated if the estimated coefficients on the lagged Table 3: Value of India’s GDP &Exports
Export in first equation are statistically different from
zero as a group (i.e. Ó ái ‘“ 0) and the set of estimated Year GDP EXPORTS
coefficients on the lagged GDP in second equation
is not statistically different from zero (i.e. Ó äj = 0). (Rs. billion) (Rs. billion)
Conversely unidirectional causality from GDP to
Export exists if the set of lagged Export coefficients 1990-91 13478.89 325.58
in first equation is not statistically different from zero
(i.e., Ó ái ‘“ 0) and the set of the lagged GDP 1991-92 13671.71 440.42
coefficients in second equation is statistically
significant from zero (i.e. Ó äj ‘“ 0). 1992-93 14405.03 536.88
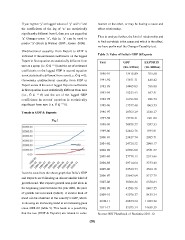
Trends in GDP & Exports 1993-94 15223.43 697.51
Fig.1 1994-95 16196.94 826.74
It can be seen from the above graph that India’s GDP 1995-96 17377.40 1063.53
and Exports are following an almost similar kind of
growth trend. The exports growth was quite slow in 1996-97 18763.19 1188.17
the beginning years but since the year 2001, the pace
of growth has increased (table3). A similar kind of 1997-98 19570.31 1301.00
trend can be observed in the country’s GDP, which
is showing an increasing trend at an increasing pace 1998-99 20878.27 1397.53
since 2001-02 (table 3). This leads to a possibility
that the two (GDP & Exports) are related in some 1999-00 22462.76 1595.61
2000-01 23427.74 2035.71
2001-02 24720.52 2090.17
2002-03 25706.90 2551.37
2003-04 27778.13 2933.66
2004-05 29714.64 3753.40
2005-06 32530.73 4564.18
2006-07 35643.64 5717.79
2007-08 38966.36 6558.64
2008-09 41586.76 8407.55
2009-10 45076.37 8455.34
2010-11 48859.54 11429.22
2011-12 52025.14 14659.59
Source: RBI Handbook of Statistics 2011-12
(26)
the coefficients of the lag of ‘x’ are statistically effect relationship.
significantly different from 0, then you can argue that
‘x’ Granger-cause ‘y’, this is, ‘x’ can be used to Thus to analyse further, the kind of relationship and
predict ‘y’ (Stock & Watson -2007-, Green -2008). to find out which is the cause and which is the effect,
we have performed the Granger Causality test.
Unidirectional causality from Export to GDP is
indicated if the estimated coefficients on the lagged Table 3: Value of India’s GDP &Exports
Export in first equation are statistically different from
zero as a group (i.e. Ó ái ‘“ 0) and the set of estimated Year GDP EXPORTS
coefficients on the lagged GDP in second equation
is not statistically different from zero (i.e. Ó äj = 0). (Rs. billion) (Rs. billion)
Conversely unidirectional causality from GDP to
Export exists if the set of lagged Export coefficients 1990-91 13478.89 325.58
in first equation is not statistically different from zero
(i.e., Ó ái ‘“ 0) and the set of the lagged GDP 1991-92 13671.71 440.42
coefficients in second equation is statistically
significant from zero (i.e. Ó äj ‘“ 0). 1992-93 14405.03 536.88
Trends in GDP & Exports 1993-94 15223.43 697.51
Fig.1 1994-95 16196.94 826.74
It can be seen from the above graph that India’s GDP 1995-96 17377.40 1063.53
and Exports are following an almost similar kind of
growth trend. The exports growth was quite slow in 1996-97 18763.19 1188.17
the beginning years but since the year 2001, the pace
of growth has increased (table3). A similar kind of 1997-98 19570.31 1301.00
trend can be observed in the country’s GDP, which
is showing an increasing trend at an increasing pace 1998-99 20878.27 1397.53
since 2001-02 (table 3). This leads to a possibility
that the two (GDP & Exports) are related in some 1999-00 22462.76 1595.61
2000-01 23427.74 2035.71
2001-02 24720.52 2090.17
2002-03 25706.90 2551.37
2003-04 27778.13 2933.66
2004-05 29714.64 3753.40
2005-06 32530.73 4564.18
2006-07 35643.64 5717.79
2007-08 38966.36 6558.64
2008-09 41586.76 8407.55
2009-10 45076.37 8455.34
2010-11 48859.54 11429.22
2011-12 52025.14 14659.59
Source: RBI Handbook of Statistics 2011-12
(26)