Page 52 - IILMGSM Journal_Management Perspective
P. 52
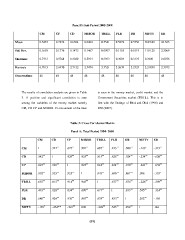
Panel D: Sub Period 2005-2008
CM CP CD MIBOR TBILL PLR DR NIFTY ER
0.5437
Mean 0.1693 0.7272 0.6584 0.6404 0.5541 0.5972 0.5756 3627.89 43.565
Std. Dev. 0.7213
Skewness 6.7013 0.1776 0.1473 0.1467 0.0907 0.1155 0.1019 1101.28 2.5069
Kurtosis 48
Observations 0.5768 0.4039 0.5924 0.2922 0.3904 0.3125 0.2689 0.0076
2.6970 2.7122 2.5474 2.3521 2.2639 2.2323 2.21830 2.5072
48 48 48 48 48 48 48 48
The results of correlation analysis are given in Table is seen in the money market, credit market and the
3. A positive and significant correlation is seen Government Securities market (TBILL). This is in
among the variables of the money market namely line with the findings of Bhoi and Dhal (1998) and
CM, CD CP and MIBOR. Co movement of the rates RBI (2007).
Table 3: Cross Correlation Matrix
Panel A: Total Period 1994- 2008
CM CD CP MIBOR TBILL PLR DR NIFTY ER
.680**
CM 1 .542** .627** .902** .687** .493** .924** -.169* -.319**
.930**
CD .542** 1 .929** .925** .815** .828** .867** -.234** -.620**
.878**
CP .627** .929** 1 .925** .914** .834** .833** -.221** -.632**
1
MIBOR .902** .925** .925** 1 .943** .690** .292** .096 -.195*
TBILL .687** .815** .914** .943** 1 .677** -.226** -.589**
PLR .493** .828** .834** .690** .677** 1 .545** -.314**
DR .680** .924** .930** .867** .878** .833** .292** -.103
NIFTY -.169* -.234** -.221** .096 -.226** .545** 1 .146
(51)