
Page 6 - Foundation of Presentation KWE version 3 190319
P. 6
8 0% 7 0% 6 0% 5 0% 4 0% 3 0% 2 0% 1 0%
0%
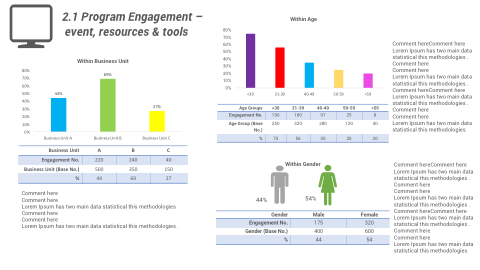
Within Business Unit 40% 30%
69% 20% 10% 0%
2.1 Program Engagement – event, resources & tools
Within Age
80% 70% 60% 50%
Comment hereComment here Lorem Ipsum has two main data
statistical this methodologies . Comment here
Comment here
Lorem Ipsum has two main data statistical this methodologies . Comment hereComment here Lorem Ipsum has two main data statistical this methodologies . Comment here
Comment here
Lorem Ipsum has two main data statistical this methodologies
4 4 %
Business Unit A
Business Unit
Engagement No.
<3 0
3 1- 39
<30
250
4 0- 49
31-39
320
5 0- 59 >5 9
50-59 >59
120 40
27% Age Groups Age Group (Base
40-49
280
Engagement No.
190 180 97
25 8
No.)
%
75 56 35
25 20
Business Unit (Base No.)
Business Unit B Business Unit C
A B C
220 240 40
500 350 150
Within Gender
54%
Male
400
% 44 69 27
Comment here
Comment here 44% Lorem Ipsum has two main data statistical this methodologies
Comment here
Comment here
Lorem Ipsum has two main data statistical this methodologies .
Female
600
Gender Gender (Base No.)
Engagement No. 175
320
% 44
54
