
Page 8 - Foundation of Presentation KWE version 3 190319
P. 8
2 0% 1 8% 1 6% 1 4% 1 2% 1 0%
8% 6% 4% 2% 0%
40-49
31-39
320
40-49
280
50-59
50-59
120
>59
>59
40
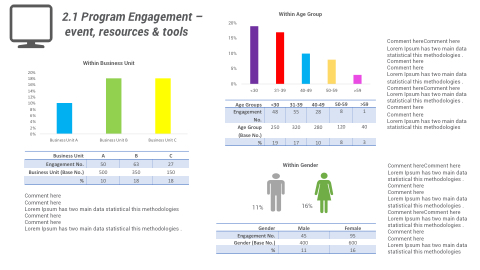
2.1 Program Engagement – event, resources & tools
Within Age Group
Within Business Unit
20% 15% 10%
5%
0%
<30 31-39
Age Groups <30
Age Group 250 (Base No.)
Comment hereComment here Lorem Ipsum has two main data
statistical this methodologies . Comment here
Comment here
Lorem Ipsum has two main data statistical this methodologies . Comment hereComment here Lorem Ipsum has two main data statistical this methodologies . Comment here
Comment here
Lorem Ipsum has two main data statistical this methodologies
Engagement No.
48 55 28
81
Business Unit A
Business Unit B
A
500
Business Unit C
C
150
%
19 17 10
83
Business Unit Business Unit (Base No.)
Comment here Comment here
B
350
Within Gender
16%
Male
45
400
Engagement No. 50
63 27
% 10
18 18
Lorem Ipsum has two main data statistical this methodologies Comment here
Comment here
Lorem Ipsum has two main data statistical this methodologies .
11%
Gender
Engagement No.
Gender (Base No.)
Female
95
600
% 11 16
