
Page 116 - British council B1
P. 116
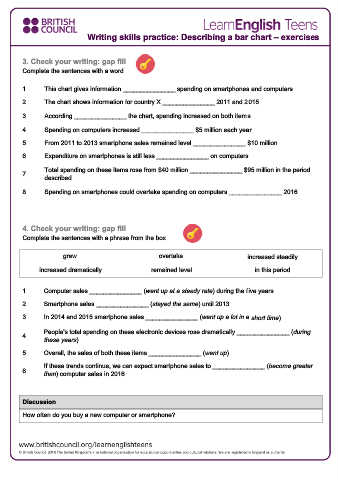
Writing skills practice: Describing a bar chart – exercises


         3. Check your writing: gap fill

         Complete the sentences with a word.


         1.      This chart gives information _______________ spending on smartphones and computers.

         2.      The chart shows information for country X _______________ 2011 and 2015.

         3.      According _______________ the chart, spending increased on both items.

         4.      Spending on computers increased _______________ $5 million each year.
         5.      From 2011 to 2013 smartphone sales remained level _______________ $10 million.


         6.      Expenditure on smartphones is still less _______________ on computers.
                 Total spending on these items rose from $40 million _______________ $95 million in the period
         7.
                 described.

         8.      Spending on smartphones could overtake spending on computers _______________ 2016.


         4. Check your writing: gap fill

         Complete the sentences with a phrase from the box.


                       grew                              overtake                       increased steadily
               increased dramatically                 remained level                      in this period


         1.     Computer sales _______________ (went up at a steady rate) during the five years.

         2.     Smartphone sales _______________ (stayed the same) until 2013.

         3.     In 2014 and 2015 smartphone sales _______________ (went up a lot in a short time).

                People's total spending on these electronic devices rose dramatically _______________ (during
         4.
                these years).

         5.     Overall, the sales of both these items _______________ (went up).

                If these trends continue, we can expect smartphone sales to _______________ (become greater
         6.
                than) computer sales in 2016.


         Discussion

         How often do you buy a new computer or smartphone?