


Page 44 - Banking Finance February 2026
P. 44
ARTICLE

         rewarding investment, by delivering remarkable returns, re-  going and expected geopolitical turmoil. The RBI purchased
         inforcing its reputation of the most valuable asset class. The  around 57.49 tonnes of gold in the last fiscal year (FY 25). A
         following graph shows this long-term appreciation in value  similar trend has been observed among most central banks.
         of gold, which reflects the enduring trust individuals place  Historically, gold has often moved in the opposite direction
         in gold as their most preferred asset class.         of the US dollar; therefore, central banks hold gold to hedge
                                                              against any unfavorable movement of the US dollar.
           Drawing from the above graph, the fol-
                                                              Most central banks regard gold volatility as a systemic fac-
          lowing table shows decade wise growth:
                                                              tor to hedge, and therefore the central banks of countries
           Decade       Start Price   End Price   Growth      like Poland, China, Turkey, India, and Kazakhstan have ac-
                           (Rs.)        (Rs.)       (%)       celerated their gold accumulation in recent months. How-
           1970-1979         184           937     409.24     ever, due to rising gold prices, cumulative gold purchases
                                                              around the world have somewhat slowed down, especially
           1980-1989        1,330        3,140     136.09
                                                              in the April-June 2025 period, however it has again picked
           1990-1999        3,200        4,234      32.31     up from July onwards. As per the data of the World Gold
           2000-2009        4,400       14,500     229.55     Council, reported on September 3, 2025, the total official
           2010-2019       18,500       35,220      90.38     gold held by central banks around the world stands around
                                                              27054.15 tonnes.
           2020-2025       48,651     1,19,597     145.80
                                                              According to the World Gold Council, in the past decade
         Gold has consistently appreciated in value across decades,
         with witnessing steepest rise in the 1970s and 2000s. The  (2015-2024), the global annual average demand for gold
         current decade (starting from 2020) is also showing a ro-  has been around 4,338 tonnes against the average annual
         bust growth of 145.80%, reaffirming the role of gold as a  supply of 4,771 tonnes, which was largely driven by 75% of
                                                              mined gold and 25% of recycled gold. As far as the demand
         reliable long-term investment.
                                                              is concerned, gold consumption in the form of jewelry re-
                                                              mains the single largest segment, accounting for almost
         Global Gold Reserve and Consumption                  49% of average annual demand, followed by bars and coins
         Patterns-                                            at 25%, purchases by central banks at 15%, various techni-

         In the last few years, central banks of many countries have  cal usages at 8%, and ETFs and similar products at 3%. As
         increased their gold purchases to safeguard against the on-  per the aforementioned data, as of 2024, the total above-
                                                                                          ground stock of gold stood
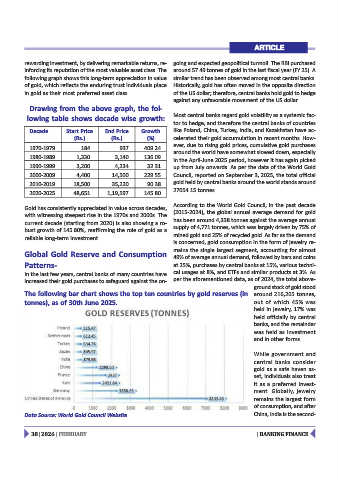
         The following bar chart shows the top ten countries by gold reserves (in         around 216,265 tonnes,
         tonnes), as of 30th June 2025.                                                   out of which 45% was
                                                                                          held in jewelry, 17% was
                                                                                          held officially by central
                                                                                          banks, and the remainder
                                                                                          was held as investment
                                                                                          and in other forms.

                                                                                          While government and
                                                                                          central banks consider
                                                                                          gold as a safe haven as-
                                                                                          set, individuals also treat
                                                                                          it as a preferred invest-
                                                                                          ment. Globally, jewelry
                                                                                          remains the largest form
                                                                                          of consumption, and after
         Data Source: World Gold Council Website                                          China, India is the second-


            38 | 2026 | FEBRUARY                                                           | BANKING FINANCE

