
Page 56 - Banking Finance February 2022
P. 56
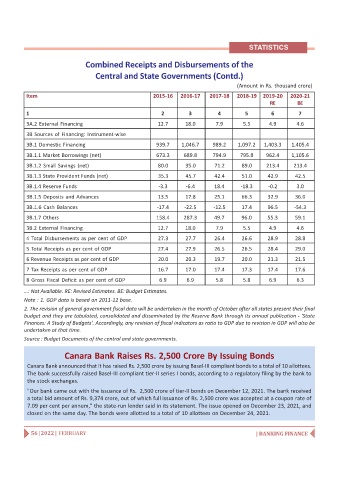
STATISTICS

                               Combined Receipts and Disbursements of the

                                   Central and State Governments (Contd.)
                                                                                    (Amount in Rs. thousand crore)
          Item                                         2015-16  2016-17    2017-18  2018-19  2019-20   2020-21
                                                                                                RE       BE
          1                                               2        3          4        5        6         7

          3A.2 External Financing                       12.7      18.0       7.9      5.5      4.9       4.6
          3B Sources of Financing: Instrument-wise
          3B.1 Domestic Financing                       939.7    1,046.7    989.2    1,097.2  1,403.3  1,405.4

          3B.1.1 Market Borrowings (net)                673.3     689.8     794.9    795.8    962.4    1,105.6
          3B.1.2 Small Savings (net)                    80.0      35.0      71.2      89.0    213.4     213.4
          3B.1.3 State Provident Funds (net)             35.3     45.7      42.4      51.0     42.9      42.5
          3B.1.4 Reserve Funds                           -3.3     -6.4      18.4      -18.3    -0.2      3.0

          3B.1.5 Deposits and Advances                  13.5      17.8      25.1      66.3     32.9      36.0
          3B.1.6 Cash Balances                          -17.4     -22.5     -12.5     17.4     96.5     -54.3
          3B.1.7 Others                                 158.4     287.3     49.7      96.0     55.3      59.1

          3B.2 External Financing                       12.7      18.0       7.9      5.5      4.9       4.6
          4 Total Disbursements as per cent of GDP       27.3     27.7      26.4      26.6     28.9      28.8
          5 Total Receipts as per cent of GDP           27.4      27.9      26.5      26.5     28.4      29.0
          6 Revenue Receipts as per cent of GDP          20.0     20.3      19.7      20.0     21.3      21.5
          7 Tax Receipts as per cent of GDP             16.7      17.0      17.4      17.3     17.4      17.6

          8 Gross Fiscal Deficit as per cent of GDP      6.9       6.9       5.8      5.8      6.9       6.3
         …: Not Available. RE: Revised Estimates. BE: Budget Estimates.
         Note : 1. GDP data is based on 2011-12 base.
         2. The revision of general government fiscal data will be undertaken in the month of October after all states present their final
         budget and they are tabulated, consolidated and disseminated by the Reserve Bank through its annual publication - 'State
         Finances: A Study of Budgets'. Accordingly, any revision of fiscal indicators as ratio to GDP due to revision in GDP will also be
         undertaken at that time.
         Source : Budget Documents of the central and state governments.

                        Canara Bank Raises Rs. 2,500 Crore By Issuing Bonds

           Canara Bank announced that it has raised Rs. 2,500 crore by issuing Basel-III compliant bonds to a total of 10 allottees.
           The bank successfully raised Basel-III compliant tier-II series I bonds, according to a regulatory filing by the bank to
           the stock exchanges.
           "Our bank came out with the issuance of Rs.  2,500 crore of tier-II bonds on December 12, 2021. The bank received
           a total bid amount of Rs. 9,374 crore, out of which full issuance of Rs. 2,500 crore was accepted at a coupon rate of
           7.09 per cent per annum," the state-run lender said in its statement. The issue opened on December 23, 2021, and
           closed on the same day. The bonds were allotted to a total of 10 allottees on December 24, 2021.


            56 | 2022 | FEBRUARY                                                           | BANKING FINANCE