
Page 62 - Life Insurance Today July - December 2020
P. 62
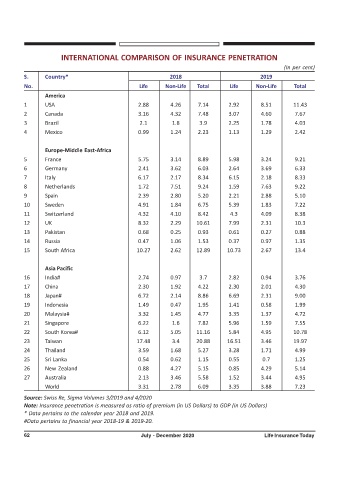
INTERNATIONAL COMPARISON OF INSURANCE PENETRATION
                                                                                                     (In per cent)
         S.      Country*                                    2018                           2019
         No.                                      Life     Non-Life   Total       Life     Non-Life     Total
                 America
         1       USA                              2.88       4.26      7.14      2.92        8.51       11.43
         2       Canada                           3.16       4.32      7.48      3.07        4.60        7.67
         3       Brazil                           2.1        1.8       3.9       2.25        1.78        4.03
         4       Mexico                           0.99       1.24      2.23      1.13        1.29        2.42


                 Europe-Middle East-Africa
         5       France                           5.75       3.14      8.89      5.98        3.24        9.21
         6       Germany                          2.41       3.62      6.03      2.64        3.69        6.33
         7       Italy                            6.17       2.17      8.34      6.15        2.18        8.33
         8       Netherlands                      1.72       7.51      9.24      1.59        7.63        9.22
         9       Spain                            2.39       2.80      5.20      2.21        2.88        5.10
         10      Sweden                           4.91       1.84      6.75      5.39        1.83        7.22
         11      Switzerland                      4.32       4.10      8.42       4.3        4.09        8.38
         12      UK                               8.32       2.29     10.61      7.99        2.31        10.3
         13      Pakistan                         0.68       0.25      0.93      0.61        0.27        0.88
         14      Russia                           0.47       1.06      1.53      0.37        0.97        1.35
         15      South Africa                    10.27       2.62     12.89      10.73       2.67        13.4


                 Asia Pacific
         16      India#                           2.74       0.97      3.7       2.82        0.94        3.76
         17      China                            2.30       1.92      4.22      2.30        2.01        4.30
         18      Japan#                           6.72       2.14      8.86      6.69        2.31        9.00
         19      Indonesia                        1.49       0.47      1.95      1.41        0.58        1.99
         20      Malaysia#                        3.32       1.45      4.77      3.35        1.37        4.72
         21      Singapore                        6.22       1.6       7.82      5.96        1.59        7.55
         22      South Korea#                     6.12       5.05     11.16      5.84        4.95       10.78
         23      Taiwan                          17.48       3.4      20.88      16.51       3.46       19.97
         24      Thailand                         3.59       1.68      5.27      3.28        1.71        4.99
         25      Sri Lanka                        0.54       0.62      1.15      0.55        0.7         1.25
         26      New Zealand                      0.88       4.27      5.15      0.85        4.29        5.14
         27      Australia                        2.13       3.46      5.58      1.52        3.44        4.95
                 World                            3.31       2.78      6.09      3.35        3.88        7.23

         Source: Swiss Re, Sigma Volumes 3/2019 and 4/2020
         Note: Insurance penetration is measured as ratio of premium (in US Dollars) to GDP (in US Dollars)
         * Data pertains to the calendar year 2018 and 2019.
         #Data pertains to financial year 2018-19 & 2019-20.

         62                                        July - December 2020                       Life Insurance Today