
Page 55 - Banking Finance January 2022
P. 55
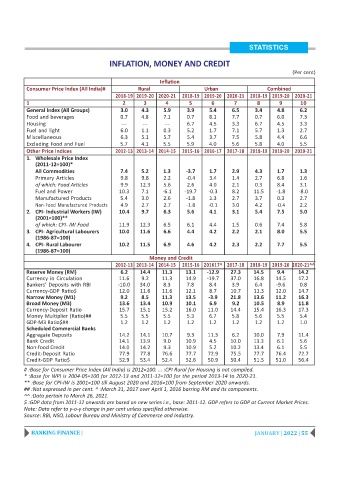
STATISTICS

                                       INFLATION, MONEY AND CREDIT
                                                                                                        (Per cent)
                                                         Inflation
          Consumer Price Index (All India)#       Rural                  Urban                 Combined
                                          2018-19 2019-20 2020-21  2018-19 2019-20 2020-21  2018-19 2019-20 2020-21
          1                                 2      3       4       5       6       7       8       9      10
          General Index (All Groups)       3.0     4.3    5.9      3.9     5.4    6.5      3.4    4.8     6.2
          Food and beverages               0.7     4.8    7.1      0.7    8.1     7.7      0.7    6.0     7.3
          Housing                           ---    ---     ---     6.7     4.5    3.3      6.7    4.5     3.3
          Fuel and light                   6.0     1.1    0.3      5.2    1.7     7.1      5.7    1.3     2.7
          Miscellaneous                    6.3     5.1    5.7      5.4     3.7    7.5      5.8    4.4     6.6
          Excluding Food and Fuel          5.7     4.1    5.5      5.9    4.0     5.6     5.8     4.0     5.5
          Other Price Indices             2012-13 2013-14 2014-15  2015-16 2016-17 2017-18  2018-19 2019-20 2020-21
          1. Wholesale Price Index
             (2011-12=100)*
             All Commodities               7.4     5.2    1.3     -3.7     1.7    2.9      4.3    1.7     1.3
             Primary Articles              9.8     9.8    2.2     -0.4     3.4    1.4      2.7    6.8     1.6
             of which: Food Articles       9.9    12.3    5.6      2.6     4.0    2.1      0.3    8.4     3.1
             Fuel and Power                10.3    7.1    -6.1    -19.7   -0.3    8.2     11.5    -1.8    -8.0
             Manufactured Products         5.4     3.0    2.6     -1.8     1.3    2.7      3.7    0.3     2.7
             Non-Food Manufactured Products  4.9   2.7    2.7     -1.8    -0.1    3.0      4.2    -0.4    2.2
          2. CPI- Industrial Workers (IW)  10.4    9.7    6.3      5.6     4.1    3.1      5.4    7.5     5.0
             (2001=100)**
             of which: CPI- IW Food        11.9   12.3    6.5      6.1     4.4    1.5      0.6    7.4     5.8
          3. CPI- Agricultural Labourers   10.0   11.6    6.6      4.4     4.2    2.2      2.1    8.0     5.5
             (1986-87=100)
          4. CPI- Rural Labourer           10.2   11.5    6.9      4.6     4.2    2.3      2.2    7.7     5.5
             (1986-87=100)
                                                     Money and Credit
                                          2012-13 2013-14 2014-15  2015-16 201617^ 2017-18  2018-19 2019-20 2020-21^^
          Reserve Money (RM)               6.2    14.4    11.3    13.1    -12.9   27.3    14.5    9.4     14.2
          Currency in Circulation          11.6    9.2    11.3    14.9    -19.7   37.0    16.8    14.5    17.2
          Bankers’ Deposits with RBI      -10.0   34.0    8.3      7.8    8.4     3.9     6.4     -9.6    0.8
          Currency-GDP Ratio$              12.0   11.6    11.6    12.1     8.7    10.7    11.3    12.0    14.7
          Narrow Money (M1)                9.2     8.5    11.3    13.5    -3.9    21.8    13.6    11.2    16.3
          Broad Money (M3)                 13.6   13.4    10.9    10.1     6.9     9.2    10.5    8.9     11.8
          Currency-Deposit Ratio           15.7   15.1    15.2    16.0    11.0    14.4    15.4    16.3    17.3
          Money Multiplier (Ratio)##       5.5     5.5    5.5      5.3    6.7     5.8     5.6     5.5     5.4
          GDP-M3 Ratio$##                  1.2     1.2    1.2      1.2    1.2     1.2      1.2    1.2     1.0
          Scheduled Commercial Banks
          Aggregate Deposits               14.2   14.1    10.7     9.3    11.3    6.2     10.0    7.9     11.4
          Bank Credit                      14.1   13.9    9.0     10.9    4.5     10.0    13.3    6.1     5.6
          Non-food Credit                  14.0   14.2    9.3     10.9     5.2    10.2    13.4    6.1     5.5
          Credit-Deposit Ratio             77.9   77.8    76.6    77.7    72.9    75.5    77.7    76.4    72.7
          Credit-GDP Ratio$                52.9   53.4    52.4    52.6    50.9    50.4    51.5    51.0    56.4
         # :Base for Consumer Price Index (All India) is 2012=100. … :CPI Rural for Housing is not compiled.
         * :Base for WPI is 2004-05=100 for 2012-13 and 2011-12=100 for the period 2013-14 to 2020-21.
         ** :Base for CPI-IW is 2001=100 till August 2020 and 2016=100 from September 2020 onwards.
         ## :Not expressed in per cent. ^ :March 31, 2017 over April 1, 2016 barring RM and its components.
         ^^ :Data pertain to March 26, 2021.
         $ :GDP data from 2011-12 onwards are based on new series i.e., base: 2011-12. GDP refers to GDP at Current Market Prices.
         Note: Data refer to y-o-y change in per cent unless specified otherwise.
         Source: RBI, NSO, Labour Bureau and Ministry of Commerce and Industry.


            BANKING FINANCE |                                                             JANUARY | 2022 | 55