
Page 153 - Operations Strategy
P. 153
128 CHAPTER 4 • CAPACiTy sTRATEgy
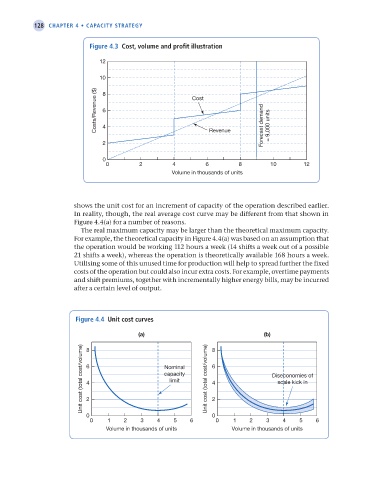
Figure 4.3 Cost, volume and profit illustration
12
10 8
Costs/Revenue ($) 6 4 Cost Forecast demand = 9,000 units
2 Revenue
0
0 2 4 6 8 10 12
Volume in thousands of units
shows the unit cost for an increment of capacity of the operation described earlier.
In reality, though, the real average cost curve may be different from that shown in
Figure 4.4(a) for a number of reasons.
The real maximum capacity may be larger than the theoretical maximum capacity.
For example, the theoretical capacity in Figure 4.4(a) was based on an assumption that
the operation would be working 112 hours a week (14 shifts a week out of a possible
21 shifts a week), whereas the operation is theoretically available 168 hours a week.
Utilising some of this unused time for production will help to spread further the fixed
costs of the operation but could also incur extra costs. For example, overtime payments
and shift premiums, together with incrementally higher energy bills, may be incurred
after a certain level of output.
Figure 4.4 unit cost curves
(a) 8 (b)
Unit cost (total cost/volume) 6 Nominal Unit cost (total cost/volume) 6 Diseconomies of
8
capacity
limit
scale kick in
4
4
2
0
0 2
0 1 2 3 4 5 6 0 1 2 3 4 5 6
Volume in thousands of units Volume in thousands of units
M04 Operations Strategy 62492.indd 128 02/03/2017 13:02