Page 35 - CON Boardpack Nov 20191021 v00-01
P. 35

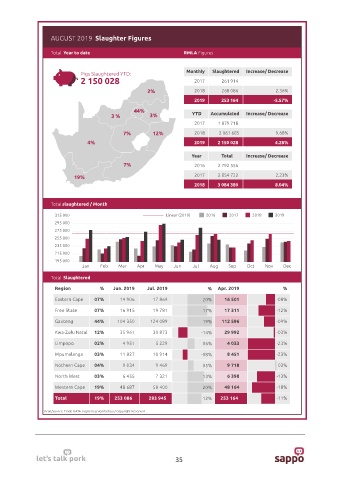
AUGUST 2019  Slaughter Figures

                   Total  Year to date                            RMLA Figures


                             Pigs Slaughtered YTD:                Monthly   Slaughtered  Increase/ Decrease
                             2 150 028                               2017                261 914
                                                     2%              2018                268 086   2.36%
                                                                     2019                253 164   -5.57%

                                                44%
                                        3 %           3%            YTD     Accumulated  Increase/ Decrease
                                                                     2017            1 879 718
                                            7%         12%           2018             2 061 685   9.68%
                                4%                                   2019    2 150 028            4.28%


                                                                    Year       Total        Increase/ Decrease
                                            7%                       2016            2 792 556

                           19%                                       2017            2 854 722    2.23%
                                                                     2018            3 084 380    8.04%


                   Total slaughtered / Month

                    315 000                                Linear (2019)  2016    2017    2018    2019
                    295 000
                    275 000
                    255 000
                    235 000
                    215 000
                    195 000
                              Jan   Feb    Mar   Apr   May    Jun    Jul   Aug   Sep    Oct   Nov    Dec
                   Total  Slaughtered

                    Region          %    Jun. 2019   Jul. 2019            %   Apr. 2019             %
                    Eastern Cape  07%      14 906      17 869           20%     16 501            -08%
                    Free State    07%      16 915      19 781           17%     17 311            -12%

                    Gauteng       44%     104 350     124 089           19%    112 596            -09%
                    Kwa-Zulu Natal  12%    35 961      30 873           -14%    29 992            -03%

                    Limpopo       02%       4 951       5 229           06%      4 033            -23%
                    Mpumalanga    03%      11 827      10 914           -08%     8 451            -23%
                    Nothern Cape  04%       9 034       9 469           05%      9 718             03%

                    North West    03%       6 455       7 321           13%      6 398            -13%
                    Western Cape  19%      48 687      58 400           20%     48 164            -18%

                    Total         19%        253 086    283 945         12%         253 164       -11%

                 Bron/Source: Trade DATA. Kopierreg Voorbehou / Copyright Reserved


                                                               35
   30   31   32   33   34   35   36   37   38   39   40