Page 8 - bhp_test_report
P. 8

FY2016
             4.3               FY2017
                               4.2
                                    (1)
          Strategic Report  Governance at BHP  Remuneration Report  Directors’ Report  Financial Statements  Additional information  Shareholder information

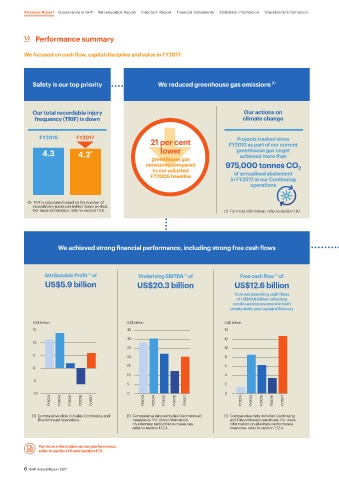
          1.3   Performance summary

          We focused on cash flow, capital discipline and value in FY2017.


             Safety is our top priority                  We reduced greenhouse gas emissions     (1)


            Our total recordable injury                                                Our actions on
             frequency (TRIF) is down                                                 climate change


               FY2016       FY2017                                                  Projects tracked since
                                                      21 per cent                FY2013 as part of our current
                4.3         4.2  (1)                     lower                      greenhouse gas target
                                                                                     achieved more than
                                                      greenhouse gas
                                                    emissions compared          975,000 tonnes CO
                                                       to our adjusted                                    2
                                                      FY2006 baseline              of annualised abatement
                                                                                  in FY2017 at our Continuing
                                                                                         operations


           (1)  TRIF is calculated based on the number of
             recordable injuries per million hours worked.
             For more information, refer to section 1.6.1.                      (1)  For more information, refer to section 1.6.1.


                     We achieved strong financial performance, including strong free cash flows


                 Attributable Profit  of          Underlying EBITDA  of              Free cash flow  of
                                 (1)
                                                                                                  (1)
                                                                  (1)
                 US$5.9 billion                  US$20.3 billion                   US$12.6 billion
                                                                                   from net operating cash flows
                                                                                    of US$16.8 billion reflecting
                                                                                   continued improvement in both
                                                                                  productivity and capital efficiency
             US$ billion                      US$ billion                       US$ billion
             15                               35                                14
                                              30                                12
             10
                                              25                                10
             5                                20                                8

                                              15                                6
             0
                                              10                                4
             -5
                                              5                                 2
             -10                              0                                 0
                   FY2013  FY2014  FY2015  FY2016  FY2017  FY2013  FY2014  FY2015  FY2016  FY2017  FY2013  FY2014  FY2015  FY2016  FY2017

            (1)  Comparative data includes Continuing and   (1)  Comparative data excludes Discontinued   (1)  Comparative data includes Continuing
              Discontinued operations.          operations. For more information    and Discontinued operations. For more
                                                on alternate performance measures,    information on alternate performance
                                                refer to section 1.12.4.          measures, refer to section 1.12.4.


               For more information on our performance,
               refer to section 1.6 and section 1.12.


          6  BHP Annual Report 2017
   3   4   5   6   7   8   9   10   11   12   13