
Page 34 - McCann's Sales Presentation (9.12)
P. 34
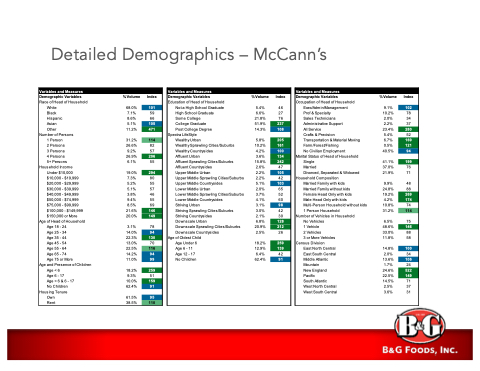
                         Detailed Demographics – McCann’s
 Variables and Measures
Demographic Variables %Volume Index Race of Head of Household
White   68.0%
 101
 Black 7.1% 59 Hispanic 8.6% 66
 Asian 5.1% Other 11.2%
 105
 471
 Number of Persons
1 Person   31.2%
 114
 2 Persons 26.6% 82 3 Persons 9.2% 57
4 Persons   26.9%
 206
 5+ Persons 6.1% 55
 Variables and Measures
Demographic Variables %Volume Index Education of Head of Household
 Not a High School Graduate 5.4% 46
 High School Graduate 6.6% 27 Some College 21.8% 76
 College Graduate 51.9% Post College Degree 14.3%
 237
 108
 Spectra LifeStyle
Wealthy Urban   5.8%
 205 161
 Wealthy Sprawling Cities/Suburbs 10.2% Wealthy Countrysides 4.2%
 100
Affluent Urban   3.6%
 134 242
 Affluent Sprawling Cities/Suburbs 15.8%
 Affluent Countrysides 2.6% 47
 Upper Middle Urban 2.2%
 105
 Upper Middle Sprawling Cities/Suburbs 2.2% 42
 Upper Middle Countrysides 5.1%
 103
 Lower Middle Urban
Lower Middle Sprawling Cities/Suburbs Lower Middle Countrysides
2.0% 65 3.7% 52 4.1% 60
Striving Urban   3.1%
 98
 Striving Sprawling Cities/Suburbs 3.0% 42
 Variables and Measures
Demographic Variables %Volume Index Occupation of Head of Household
 Exec/Admin/Management 9.1%
 102
 Prof & Specialty 10.2% 78 Sales Technicians 2.0% 34
 Administrative Support 2.2% 37
All Service   23.4%
 280
 Crafts & Precision 5.4% 52
 Transportation & Material Moving 6.7% Farm/Forest/Fishing 0.5%
No Civilian Employment
40.5%
 169 121
 94
 Marital Status of Head of Household
Single   41.1%
 199
Married   37.0% 76
 Divorced, Separated & Widowed 21.9% 71
 Household Composition
 Married Family with kids 9.9% 48
 Married Family without kids 24.8% 88
 Female Head Only with kids 19.2% Male Head Only with kids 4.2%
 269 174
 Multi-Person Household without kids 10.8% 74
 1 Person Household 31.2%
 114
 Number of Vehicles in Household
No Vehicles 6.5% 75
1 Vehicle   48.6%
 146
 2 Vehicles 33.0% 88
3 or More Vehicles 11.8% 58 Census Division
 East North Central 14.8%
 100
 East South Central 2.0% 34
Middle Atlantic   13.6%
 106
Mountain   1.7% 24
New England   24.6%
 522 149
Pacific   22.5%
 South Atlantic 14.5% 71 West North Central 2.5% 37
 West South Central 3.6% 31
  Household Income
$20,000 - $29,999 $30,000 - $39,999
$75,000 - $99,999 $150,000 or More
Age of Head of Household
Age 18 - 24
Age 75 or More
5.2% 55 5.1% 57
8.5% 69 20.0% 149 3.1% 78
11.0% 99
Striving Countrysides
Downscale Sprawling Cities/Suburbs
2.1% 30 20.9% 212
Under $10,000   19.0%
 294
 $10,000 - $19,999 7.3% 80
   $40,000 - $49,999 3.8% 46 $50,000 - $74,999 9.4% 55
  $100,000 - $149,999 21.6%
 146
     Downscale Urban 6.8%
 128
   Age 25 - 34 14.0% Age 35 - 44 22.3%
 94
 130
 Age 45 - 54 13.0% 70
 Age 55 - 64 22.5% Age 65 - 74 14.2%
 116
 94
 Downscale Countrysides 2.5% 26 Age of Oldest Child
Age Under 6   18.2%
 259 139
Age 6 - 11   12.9%
 Age 12 - 17 6.4% 42
No Children   62.4%
 91
         Age and Presence of Children
Age < 6   18.2%
 259
Age 6 - 17   9.3% 51
 Age < 6 & 6 - 17 10.0% No Children 62.4%
 159
 91
 Housing Tenure
 Own 61.5% Rent 38.5%
 95
 110
