
Page 358 - Libro 2
P. 358
338
PART 5 — ABDOMINAL
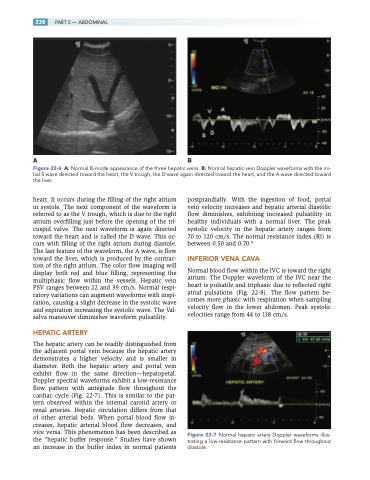
AB
Figure 22-6 A: Normal B-mode appearance of the three hepatic veins. B: Normal hepatic vein Doppler waveforms with the ini- tial S wave directed toward the heart, the V trough, the D wave again directed toward the heart, and the A wave directed toward the liver.
heart. It occurs during the filling of the right atrium in systole. The next component of the waveform is referred to as the V trough, which is due to the right atrium overfilling just before the opening of the tri- cuspid valve. The next waveform is again directed toward the heart and is called the D wave. This oc- curs with filling of the right atrium during diastole. The last feature of the waveform, the A wave, is flow toward the liver, which is produced by the contrac- tion of the right atrium. The color flow imaging will display both red and blue filling, representing the multiphasic flow within the vessels. Hepatic vein PSV ranges between 22 and 39 cm/s. Normal respi- ratory variations can augment waveforms with inspi- ration, causing a slight decrease in the systolic wave and expiration increasing the systolic wave. The Val- salva maneuver diminishes waveform pulsatility.
HEPATIC ARTERY
The hepatic artery can be readily distinguished from the adjacent portal vein because the hepatic artery demonstrates a higher velocity and is smaller in diameter. Both the hepatic artery and portal vein exhibit flow in the same direction—hepatopetal. Doppler spectral waveforms exhibit a low-resistance flow pattern with antegrade flow throughout the cardiac cycle (Fig. 22-7). This is similar to the pat- tern observed within the internal carotid artery or renal arteries. Hepatic circulation differs from that of other arterial beds. When portal blood flow in- creases, hepatic arterial blood flow decreases, and vice versa. This phenomenon has been described as the “hepatic buffer response.” Studies have shown an increase in the buffer index in normal patients
postprandially. With the ingestion of food, portal vein velocity increases and hepatic arterial diastolic flow diminishes, exhibiting increased pulsatility in healthy individuals with a normal liver. The peak systolic velocity in the hepatic artery ranges from 70 to 120 cm/s. The normal resistance index (RI) is between 0.50 and 0.70.8
INFERIOR VENA CAVA
Normal blood flow within the IVC is toward the right atrium. The Doppler waveform of the IVC near the heart is pulsatile and triphasic due to reflected right atrial pulsations (Fig. 22-8). The flow pattern be- comes more phasic with respiration when sampling velocity flow in the lower abdomen. Peak systolic velocities range from 44 to 118 cm/s.
Figure 22-7 Normal hepatic artery Doppler waveforms illus- trating a low-resistance pattern with forward flow throughout diastole.
