
Page 41 - Libro 2
P. 41
2 — Arterial Physiology
21
R1 R2 R3
Pi
Figure 2-5
Q P0
R = R1 + R2 + R3
A diagram illustrating multiple resistances in series.
For resistances in series, the total resistance of the entire system equals the sum of the individual resistances (Fig. 2-5):
RT R1 R2 R3
Thus, multiple stenoses along the same blood vessel will increase the total resistance.
For resistances in parallel, the reciprocal of the total resistance of the system equals the sum of the reciprocals of the individual resistances (Fig. 2-6):
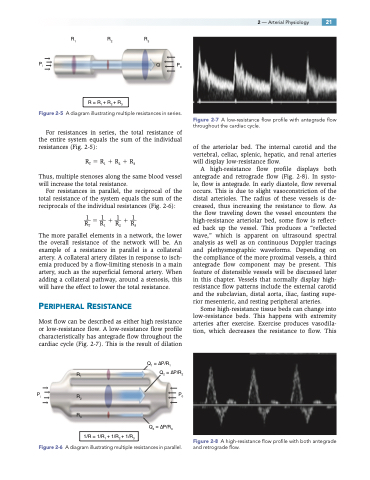
Figure 2-7 A low-resistance flow profile with antegrade flow throughout the cardiac cycle.
of the arteriolar bed. The internal carotid and the vertebral, celiac, splenic, hepatic, and renal arteries will display low-resistance flow.
A high-resistance flow profile displays both antegrade and retrograde flow (Fig. 2-8). In systo- le, flow is antegrade. In early diastole, flow reversal occurs. This is due to slight vasoconstriction of the distal arterioles. The radius of these vessels is de- creased, thus increasing the resistance to flow. As the flow traveling down the vessel encounters the high-resistance arteriolar bed, some flow is reflect- ed back up the vessel. This produces a “reflected wave,” which is apparent on ultrasound spectral analysis as well as on continuous Doppler tracings and plethysmographic waveforms. Depending on the compliance of the more proximal vessels, a third antegrade flow component may be present. This feature of distensible vessels will be discussed later in this chapter. Vessels that normally display high- resistance flow patterns include the external carotid and the subclavian, distal aorta, iliac, fasting supe- rior mesenteric, and resting peripheral arteries.
Some high-resistance tissue beds can change into low-resistance beds. This happens with extremity arteries after exercise. Exercise produces vasodila- tion, which decreases the resistance to flow. This
Figure 2-8 A high-resistance flow profile with both antegrade and retrograde flow.
_1 _1 _1 _1
RRRR T123
The more parallel elements in a network, the lower the overall resistance of the network will be. An example of a resistance in parallel is a collateral artery. A collateral artery dilates in response to isch- emia produced by a flow-limiting stenosis in a main artery, such as the superficial femoral artery. When adding a collateral pathway, around a stenosis, this will have the effect to lower the total resistance.
PERIPHERAL RESISTANCE
Most flow can be described as either high resistance or low-resistance flow. A low-resistance flow profile characteristically has antegrade flow throughout the cardiac cycle (Fig. 2-7). This is the result of dilation
R
1
Q1 = ∆P/R1
Q2 = ∆P/R2
Pi R P0 2
R3
Q3 = ∆P/R3
Figure 2-6 A diagram illustrating multiple resistances in parallel.
1/R = 1/R1 + 1/R2 + 1/R3
