
Page 124 - Libro vascular I
P. 124
Chap-09.qxd 29~8~04 14:46 Page 115
DUPLEX ASSESSMENT OF LOWER LIMB ARTERIAL DISEASE
115
Figure 9.3 Measurement of the ABPI. Probe positions
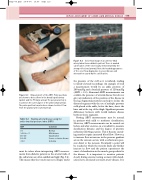
Figure 9.4 Color flow image of an anterior tibial
artery taken from a diabetic patient. There is marked calcification of the vessel walls, demonstrated by the strong reflections (arrows). Note the beaded appearance of the color flow display due to vessel disease and attenuation caused by the calcification.
the pressure of the cuff as it is inflated, leading to falsely elevated recordings. An example of such a measurement would be an ankle pressure of 280 mmHg and a brachial pressure of 120 mmHg (ABPI 2.3). Abnormal ABPI measurements can confirm the presence of arterial disease but do not give any indication of the position of the disease in the leg. Segmental pressures can help to isolate the diseased segment with the use of multiple pressure cuffs placed at the ankle, below the knee, above the knee and at the top of the thigh. Significant pressure differences between cuffs would indicate disease between those segments.
Resting ABPI measurements may be normal in patients with mild to moderate claudication. However, ABPI measurements can be carried out before and after exercise on a treadmill to measure claudication distance and the degree of pressure reduction following exercise. This is because exercis- ing muscles require increased blood flow. However, to increase flow an increase in the pressure gradient across the stenosis occurs, with a reduction in pres- sure distal to the stenosis. Eventually a point will be reached at which the stenosis limits any further increase in flow and the patient experiences the onset of claudication in the muscle groups distal to the disease. It is important to monitor patients closely during exercise testing as many with claudi- cation have associated coronary artery disease. It is
are shown to detect flow in the dorsalis pedis artery (probe) and the PT (large arrow). The peroneal artery is located on the outer aspect of the ankle (small arrow). The probe position has also been shown to detect flow from the plantar arch (curved arrow).
Table 9.3 Grading arterial disease using the ankle–brachial pressure index (ABPI)
ABPI
1
0.9 to 1 0.5–0.9 0.3–0.5 0.3
Comment
Normal
Mild disease Claudication
Severe occlusive disease Ischemia
must be taken when interpreting ABPI measure- ments from diabetic patients as the arterial walls of the calf arteries are often calcified and rigid (Fig. 9.4). This means that the vessels may not collapse under
