
Page 230 - Libro vascular I
P. 230
Chap-14.qxd 29~8~04 14:56 Page 221
GRAFT SURVEILLANCE AND PREOPERATIVE VEIN MAPPING FOR BYPASS SURGERY
221
I
G
ISVG
Stenosis
4 × velocity increase
Stenosis
6 × velocity increase
Diagrams are the simplest method of reporting the results of graft surveillance scans.
A
B
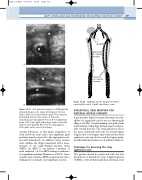
surface that is in contact with the graft. There was pus discharging from the skin surface at this point, indicating a potential graft infection. B: A longitudinal image of the same graft, indicating a suspicious area (I) lying over the graft (G). Note that the ring supports
of the graft can be seen in this image.
vascular laboratory, as this makes comparison of serial follow-up scans easier. Any significant graft problems must be reported to the appropriate med- ical staff immediately. In addition, many vascular units combine the duplex assessment with a meas- urement of the ankle–brachial pressure index (ABPI). An ABPI 1 can indicate a problem. A serial reduction 0.1 in ABPI readings is indicative of a significant problem (Brennan et al 1991). Some vascular units combine ABPI measurements with a walking test to unmask a less significant stenosis.
I
Figure 14.21
G
A: A transverse image of a PTFE graft (G) demonstrating an echo region (I) tracking to the skin
Figure 14.22
SUPERFICIAL VEIN MAPPING FOR
ARTERIAL BYPASS SURGERY
A preoperative duplex scan can determine the suit- ability of a superficial vein for use as a bypass graft (Bagi et al 1989). Careful marking of its path avoids undermining of skin flaps during surgery and pos- sible wound necrosis. The long saphenous vein is the most commonly used vein for arterial bypass surgery, due to its length. Arm veins and the short saphenous vein can also be used for bypass grafts, provided that their lumens are of sufficient diameter.
Technique for assessing the long
saphenous vein
The patient should be positioned with the feet tilted down to distend the veins. A high-frequency 10 MHz, or broad-band equivalent, flat linear array
