
Page 45 - Libro vascular I
P. 45
Chap-04.qxd 29~8~04 13:21 Page 36
36
PERIPHERAL VASCULAR ULTRASOUND
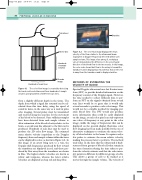
Transducer
Color box
Hundreds of sample volumes
B-mode image
A V
Baseline
Figure 4.2 The color flow image displays the mean velocity of the flow relative to the ultrasound beam (equivalent to Doppler frequency) detected within each sample volume. This image of an artery, A, overlying a
vein, V, demonstrates the difference in the velocity and direction of the blood flow in the two vessels. In this image, the color scale shows that flow in the artery is toward the transducer and is displayed as red, whereas flow in the vein is away from the transducer and is displayed as blue.
METHODS OF ESTIMATING THE
VELOCITY OF BLOOD
Spectral Doppler ultrasound uses fast Fourier trans- form (FFT) to provide detailed information on the frequency content of the Doppler signal. However, the time needed to collect sufficient data to per- form an FFT on the signals obtained from several scan lines would be so great that it would take several seconds to produce each color image. This would not be a suitable method for imaging pul- satile blood flow. The FFT would also produce more information than could be easily displayed on the image, as each color pixel can only represent one value of frequency at any point in the color image, unlike the range of frequencies that can be displayed on the spectral display. Real-time color flow imaging has been made possible by the use of alternative techniques to estimate the mean veloc- ity of blood relative to the beam. It requires only a few pulses to estimate the mean relative velocity, making the process faster to perform. The method used relies on the facts that the ultrasound is back- scattered from groups of blood cells that remain in the same formation during the time taken to per- form the velocity estimate and that the echo inten- sity pattern is different for different groups of cells. This allows a group of cells to be tracked as it moves through the sample volume. The velocity of
Hundreds of scan lines
The color flow image is created by detecting the back-scattered ultrasound from hundreds of sample volumes along hundreds of different scan lines.
from a slightly different depth in the tissue. The depth from which a signal has returned can be cal- culated from this time delay, using the speed of sound in tissue, in the same way as is used in pulse echo imaging. Several pulses must be transmitted and received along the scan line for the movement of the blood to be detected. Once sufficient samples have been detected from each sample volume to allow estimation of the blood velocity relative to the beam, a second scan line adjacent to the first can be produced. Hundreds of scan lines may be used to produce the 2D color flow image. The estimated mean relative velocity (equivalent to the Doppler frequency) from each sample volume within the tissue can be displayed in color, as shown in Figure 4.2. In this image of an artery lying next to a vein, the Doppler shift frequencies produced by flow toward the transducer are displayed in red, and those pro- duced by flow away from the transducer are shown in blue. The higher relative velocities are shown as yellow and turquoise, whereas the lower relative velocities are displayed as deep red and deep blue.
Figure 4.1
