
Page 47 - Libro vascular I
P. 47
Chap-04.qxd 29~8~04 13:21 Page 38
38
PERIPHERAL VASCULAR ULTRASOUND
Demodulator
High-pass filter
Frequency estimator
Clutter filter
Demodulator
B-scan processor
Doppler statistic estimator
Post-processor
Blood/tissue discriminator
Transmitted ultrasound
B-mode transmitter
Doppler transmitter
Combined B-mode and colour Doppler display
Spectral Doppler display
Received ultrasound
Blood flow
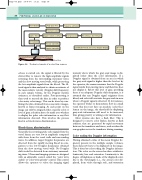
Figure 4.4 The basic elements of a color flow scanner.
echoes is carried out, the signal is filtered by the clutter filter to remove the high-amplitude signals returning from the surrounding stationary tissue and the slow moving vessel walls, while preserving the low-amplitude signals from the blood. The fil- tered signal is then analyzed to obtain an estimate of the mean relative velocity (Doppler shift frequency) in each sample volume, by the Doppler statistic estimator, as described earlier. Post-processing is then used to smooth the data in order to produce a less noisy color image. This can be done by com- bining the data obtained from consecutive images, known as frame-averaging. As each point on the image can only be assigned either a specific color or level of gray, a decision has to be made as to whether to display the pulse echo information or any flow information detected. This involves the process known as blood–tissue discrimination.
Blood–tissue discrimination
Generally, the returning pulse echo signals from the vessel lumen are very low in amplitude compared with those from the vessel walls and surrounding tissue. In addition, larger Doppler frequencies are detected from the rapidly moving blood in com- parison to the low Doppler frequencies obtained from the slow moving vessel walls. No Doppler shift would be detected from stationary surround- ing tissue. Ultrasound imaging systems are designed with an adjustable control called the ‘color write enable’ or ‘color write priority’ control. This control allows the operator to select the imaging signal
intensity above which the gray-scale image is dis- played rather than the color information. If a Doppler signal is obtained from an area in which the gray-scale signal is higher than the level set by the operator, the scanner assumes that the Doppler signal results from moving tissue and therefore does not display it. Below this level of gray, providing there is an adequate Doppler shift frequency, it is assumed that any Doppler signal originates from blood, and color will overwrite the gray-scale in areas where a Doppler signal is detected. If, for instance, the operator wishes to demonstrate flow in a small vessel that does not have an anechoic (echo-free) lumen on the image, the threshold for displaying gray-scale information will need to be increased, thus giving priority to writing color information.
Most systems also have a flash filter. This is designed to remove color flashes, known as flash artifacts, that are generated by rapid movement between the transducer and tissue, such as when the sonographer moves the transducer during scanning.
Color coding the Doppler information
Having obtained a value of the mean Doppler fre- quency present in the multiple sample volumes, these data now have to be displayed on the image. This is done by color-coding the Doppler informa- tion. The color on the screen has three attributes: luminosity, hue and saturation. Luminosity is the degree of brightness or shade of the displayed color; hue is the wavelength (i.e., the actual color dis- played, from violet through red), and saturation
