
Page 48 - Libro vascular I
P. 48
Chap-04.qxd 29~8~04 13:21 Page 39
CREATION OF A COLOR FLOW IMAGE
39
displayed along with the mean frequency by using a red and blue scale with increasing amounts of yellow or green introduced as the variance increases, although this form of display is not widely used. Another form of color display uses increasing lumi- nosity of orange to display the increasing back- scattered power detected. This is known as power Doppler and is discussed later in this chapter.
EFFECT OF ANGLE OF INSONATION
ON THE COLOR FLOW IMAGE
As the colors used to display the flow depend on the Doppler frequencies detected, which in turn depend on the angle of insonation between the blood flow and the color Doppler beam, the appearance of the color image is very much dependent on the angle of insonation. Many of the peripheral vessels run paral- lel to the skin, perpendicular to the imaging beam. However, the color Doppler beam should ideally be less than 70° in order to obtain a Doppler signal. If the angle of insonation is near 90°, only a small Doppler shift will be detected; this will be removed by the high-pass filter, known as the clutter filter, and no signal will be displayed on the image.
When using a linear array transducer, it is possi- ble to steer the beam, used to create the color image, from left or right as described in Chapter 2 (see Fig. 2.15). The direction of the color Doppler beam runs parallel to the sides of the color box dis- played on the image. Figure 4.6 demonstrates the change in the color image seen when the color box is steered in three different directions relative to the flow. The beam can only be steered either left or right by a maximum of 20–25° because the sen- sitivity of the transducer decreases as the beam is steered. There is thus a compromise between optimizing the angle of insonation and main- taining the sensitivity. This is not usually apparent when imaging large vessels with good flow but can become a problem when imaging smaller diseased vessels with low flow, as the intensity of the Doppler signal may be very low and the vessel may have to be insonated at an angle above 70° to maintain transducer sensitivity. If demonstrating color filling of such a vessel proves difficult, it is worth chang- ing the angle of insonation of the color beam to obtain the optimum compromise between the angle of insonation and sensitivity.
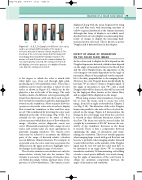
ABCDE
Figure 4.5 A, B, C, D: Examples of different color scales, used to accentuate different parts of the range of velocities detected in various clinical situations. E: The inversion of the color scale shows that the image will now display flow toward the transducer as blue. The arrows on D and E show how the scanner displays the color write priority selected. The setting selected in D
will display color in the presence of a brighter B-mode echo than the setting selected in E.
is the degree to which the color is mixed with white light (e.g., from red through light pink, producing up to 20 identifiable tints). These three attributes can be used to produce a variety of color scales, as shown in Figure 4.5, which can be dis- played as a bar at the side of the image. The scale usually consists of a different color representing dif- ferent flow directions, with red often used to show flow toward the transducer and blue depicting flow away from the transducer. Most scanners allow the operator to invert the color scale in order to display flow toward the transducer as blue and flow away as red. This is indicated by inverting the color scale displayed at the side of the image (Fig. 4.5E). It is essential for the operator to be aware of which colors represent which directions of flow within the image, other wise serious diagnostic errors can occur. Ultrasound scanners provide a range of color scales, and certain scales are more appropriate in particular imaging situations. The various color scales may be selected to accentuate the different parts of the range of detected relative velocities seen in different clinical situations. For example, in an arterial scan, the color scale may accentuate the differences in the upper portion to highlight veloc- ity changes in the higher range of velocities.
The velocity estimator can calculate not only the mean relative velocity but also the variance. The variance is a measure of the range of velocities pres- ent within the sample volume and may relate to the presence of a flow disturbance. The variance can be
