
Page 50 - Libro vascular I
P. 50
Chap-04.qxd 29~8~04 13:21 Page 41
toward the probe. In the very center, the angle of insonation is approximately 90°, so low or no Doppler frequency is detected or displayed. On the right side of the image, the angle of insonation is now such that the flow is away from the trans- ducer, and it is therefore displayed in red.
When interpreting a color image, it is important to remember that it is the Doppler shift frequency (the velocity relative to the beam) that is being displayed, and it is essential to consider the angle of insonation used to produce each point of the image. To be certain of the velocities present, spec- tral Doppler can be used as this has the facility to provide angle correction for velocity estimates. Diagnosis should be made using a combination of color and spectral Doppler investigations.
ALIASING IN COLOR FLOW IMAGING
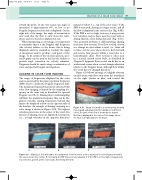
The range of frequencies displayed by the color scale is governed by the pulse repetition frequency (PRF) used to obtain the Doppler frequency shift. The maximum frequency that can be detected with color flow imaging is limited by the sampling fre- quency in the same way as described for spectral Doppler (see Ch. 3). Aliasing due to undersampling will limit the maximum frequency that can be dis- played correctly, causing frequencies beyond this limit to be displayed as flow on the opposite side of the baseline. An example of aliasing occurring in a color image is shown in Figure 4.9A. The highest velocities present are in the center of the vessel, but because of aliasing, these are displayed as turquoise (i.e., as high velocities in the opposite direction)
Image of a bend in a carotid artery showing flow toward and away from the transducer in different
colors. The path of the flow is shown by the arrows. No flow is displayed in the center of the image, where the flow is at right angles to the beam.
CREATION OF A COLOR FLOW IMAGE
41
instead of yellow (i.e., top of the color scale). If the PRF is increased, aliasing no longer occurs, and all the flow is displayed in the correct color (Fig. 4.9B). If the PRF is set too high, however, it may prevent low velocities, such as those near the vessel walls or during diastole, from being detected (Fig. 4.9C). One potential problem is differentiating aliasing from true flow reversal. True flow reversal, shown as a change in color within a vessel (i.e., from red to blue), can be seen where there is both forward and reverse flow present within a vessel due to a hemodynamic effect. Flow reversal is often seen in a normal carotid artery bulb, as described in Chapter 5. Apparent flow reversal can be due to an artifact and occurs when a vessel changes direction relative to the Doppler beam, although flow within the vessel has not changed direction.
Figure 4.10 shows an image of a slightly tortuous carotid artery, with flow away from the transducer on the right (shown in blue) and toward the
Figure 4.10
PRF 1500 HZ PRF 4000 HZ PRF 14 000 HZ ABC
Figure 4.9 Aliasing. A: This will lead to the assignment of the incorrect color to represent the velocity present within the vessel, shown here in blue. B: Increasing the PRF may overcome aliasing. C: If the PRF is set too high, it may prevent low velocities, present at the vessel walls, from being detected.
