
Page 51 - Libro vascular I
P. 51
Chap-04.qxd 29~8~04 13:22 Page 42
42
PERIPHERAL VASCULAR ULTRASOUND
transducer on the left (shown in red). The arrows marked on the image show how the direction of flow changes relative to the ultrasound beam. In the center of the image, where the direction of flow is close to being at right angles to the ultra- sound beam, low frequencies are detected; these are removed from the signal by the high-pass filter and therefore no color is displayed in this region.
It is possible to distinguish between aliasing and changes in the direction of flow relative to the transducer by the fact that the color transition seen in aliasing wraps around the farthest ends of the color scale. In contrast, the colors displayed when the flow changes direction are near the baseline and pass through black at the point where no or low Doppler shift frequencies have been detected. Figure 4.11 shows an image of a carotid artery that
demonstrates both flow reversal and aliasing. The transitions in the colors displayed in both cases are shown on the color scales.
LOWER AND UPPER LIMITS TO THE
VELOCITY DISPLAYED
The highest frequency that can be displayed with- out aliasing occurring is half the PRF, as with spec- tral Doppler. However, unlike spectral Doppler displays, aliasing does not necessarily make inter- preting the image difficult and can sometimes be useful in highlighting sudden increases in velocity, as would be seen at a stenosis. The aliasing artifact can be overcome, up to a limit, by increasing the PRF, using a larger Doppler angle or using a lower ultrasound transmitting frequency.
When investigating low-velocity flow, such as that seen in the venous system, the lower limit of the velocity that can be detected is governed by the length of time spent interrogating the flow. Suppose you wanted to estimate the speed at which the hands of a clock are moving. You would have to watch the clock for a much longer time to estimate the speed of the hour hand than to esti- mate the speed of the minute hand. The same is true of color Doppler (i.e., the lower the velocity flow that is to be detected, the longer the time that has to be spent measuring it). The length of time over which pulses are sent along a scan line in order to estimate the frequency is known as the dwell time (Fig. 4.12). If a low PRF is selected, the time taken for the eight to ten pulses to be transmitted along the scan line will be longer, and consequently the dwell time will be greater than
CCA
A
R
A
R
ICA
Image demonstrating aliasing (A) and
flow reversal (R) in an internal carotid artery. Aliasing can be recognized as a color change that wraps around from the top to the bottom of the color scale, or vice versa. A change in color due to a relative change in the direction of flow can be recognized as a change in color across the baseline, at the center of the color scale, passing through black (see color scale on right of image).
Figure 4.11
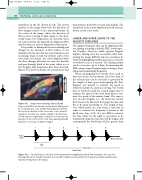
123478
PRF
Dwell time
The dwell time is the time the beam spends interrogating the blood flow to produce one scan line. This depends on the number of pulses, the ensemble length, used to perform the frequency estimate and the pulse repetition frequency of the signal.
Pulse train
Next scan line
Figure 4.12
