Page 5 - FY2016 McClendon Center Annual Report
P. 5

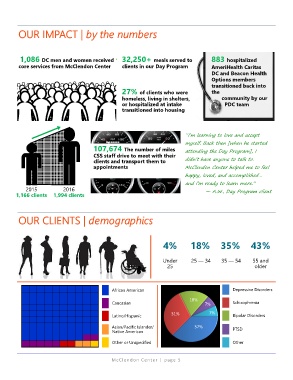
OUR IMPACT | by the numbers


          1,086 DC men and women received           32,250+ meals served to              883 hospitalized
         core services from McClendon Center        clients in our Day Program           AmeriHealth Caritas
                                                                                         DC and Beacon Health
                                                                                         Options members
                                                                                         transitioned back into
                                                    27% of clients who were              the
                                                    homeless, living in shelters,               community by our
                                                    or hospitalized at intake                     PDC team
                                                    transitioned into housing


                                                                              “I’m learning to love and accept
                                                                              myself. Back then [when he started
                                        107,674 The number of miles           attending the Day Program], I
                                        CSS staff drive to meet with their
                                        clients and transport them to         didn’t have anyone to talk to.
                                        appointments                          McClendon Center helped me to feel

                                                                              happy, loved, and accomplished…
                                                                              and I’m ready to learn more.”
            2015           2016
        1,166 clients  1,994 clients                                                   — A.W., Day Program client


         OUR CLIENTS | demographics


                                                                     4%          18%         35%  43%


                                                                     Under       25 — 34      35 — 54      55 and
                                                                       25                                  older


                                                African American                                  Depressive Disorders

                                                                                18%
                                                Caucasian                              7%         Schizophrenia

                                                Latino/Hispanic          31%            7%        Bipolar Disorders
                                                Asian/Pacific Islander/           37%             PTSD
                                                Native American
                                                Other or Unspecified                              Other


                                                McClendon Center | page  5   5  4  3  2  1
   1   2   3   4   5   6   7   8   9   10