
Page 102 - Scopus Scholarly Utilisation By Malaysian Public Tertiary Institutions 2020/21
P. 102
87
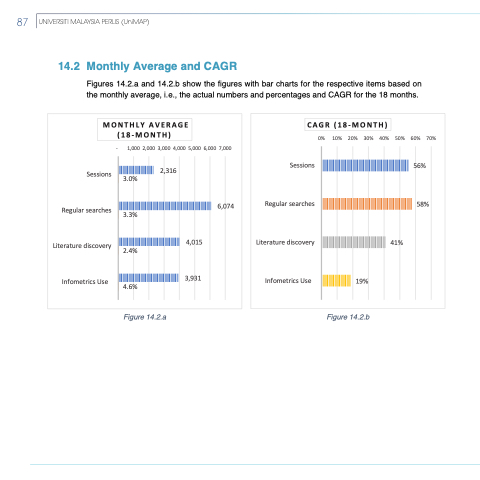
14.2 Monthly Average and CAGR
Figures 14.2.a and 14.2.b show the figures with bar charts for the respective items based on the monthly average, i.e., the actual numbers and percentages and CAGR for the 18 months.
CAGR (18-MONTH)
Sessions Regular searches Literature discovery
Infometrics Use
0% 10% 20% 30% 40% 50% 60% 70% 56%
58% 41%
19%
Figure 14.2.b
MONTHLY AVERAGE (18-MONTH)
-
1,000 2,000 3,000 4,000 5,000 6,000 7,000 2,316
Sessions Regular searches Literature discovery
Infometrics Use
4.6%
6,074 4,015
3,931
3.0%
3.3%
2.4%
Figure 14.2.a
87
UNIVERSITI MALAYSIA PERLIS (UniMAP)
