
Page 103 - Scopus Scholarly Utilisation By Malaysian Public Tertiary Institutions 2020/21
P. 103
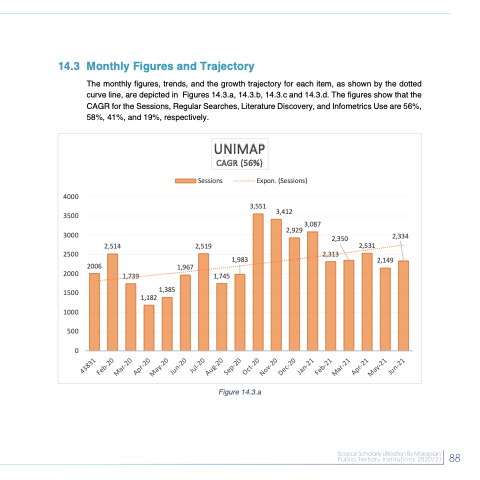
  14.3 Monthly Figures and Trajectory
The monthly figures, trends, and the growth trajectory for each item, as shown by the dotted curve line, are depicted in Figures 14.3.a, 14.3.b, 14.3.c and 14.3.d. The figures show that the CAGR for the Sessions, Regular Searches, Literature Discovery, and Infometrics Use are 56%, 58%, 41%, and 19%, respectively.
   4000
3500
3000
2500
2000
1500
1000
500 0
2006
2,514 2,519
1,967 1,739
1,385
Sessions
Expon. (Sessions)
                     1,182
UNiMAP CAGR (56%)
 1,983 1,745
3,551
3,412
 2,929 3,087
2,350
2,313
2,334 2,531
2,149
      Figure 14.3.a
 88
 88
 43831 Feb-20
Mar-20 Apr-20
May-20 Jun-20
Jul-20 Aug-20
Sep-20 Oct-20
Nov-20 Dec-20
Jan-21 Feb-21
Mar-21 Apr-21
May-21 Jun-21
