
Page 127 - Scopus Scholarly Utilisation By Malaysian Public Tertiary Institutions 2020/21
P. 127
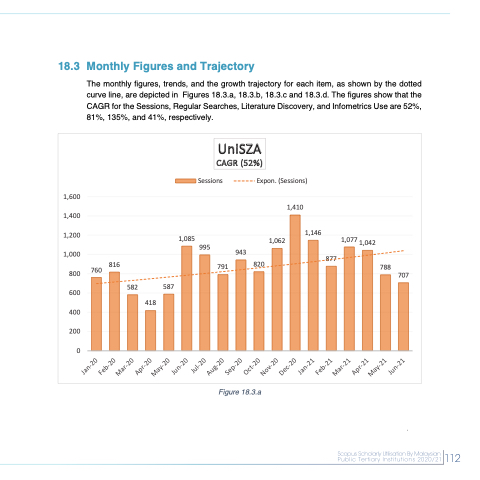
  18.3 Monthly Figures and Trajectory
The monthly figures, trends, and the growth trajectory for each item, as shown by the dotted curve line, are depicted in Figures 18.3.a, 18.3.b, 18.3.c and 18.3.d. The figures show that the CAGR for the Sessions, Regular Searches, Literature Discovery, and Infometrics Use are 52%, 81%, 135%, and 41%, respectively.
   1,600 1,400 1,200 1,000
760 816
0
1,410
Sessions
1,085 995
Expon. (Sessions)
     1,062
1,146 1,077 1,042
   943
      800
600
400
200
788 707
      582 587
    418
UniSZA CAGR (52%)
791
820
877
    Figure 18.3.a
 112
 112
 Jan-20 Feb-20
Mar-20 Apr-20
May-20 Jun-20
Jul-20 Aug-20
Sep-20 Oct-20
Nov-20 Dec-20
Jan-21 Feb-21
Mar-21 Apr-21
May-21 Jun-21
