
Page 139 - Scopus Scholarly Utilisation By Malaysian Public Tertiary Institutions 2020/21
P. 139
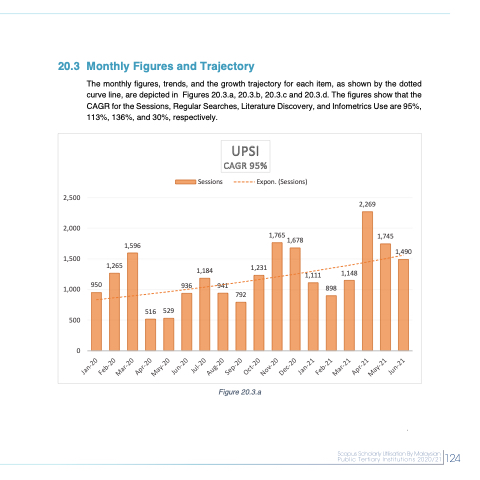
  20.3 Monthly Figures and Trajectory
The monthly figures, trends, and the growth trajectory for each item, as shown by the dotted curve line, are depicted in Figures 20.3.a, 20.3.b, 20.3.c and 20.3.d. The figures show that the CAGR for the Sessions, Regular Searches, Literature Discovery, and Infometrics Use are 95%, 113%, 136%, and 30%, respectively.
   2,500 2,000 1,500 1,000
500 0
1,596 1,265
950
2,269
1,745 1,490
Sessions
Expon. (Sessions)
1,765 1,678
                     516 529
936
941
1,184
1,231
UPSI CAGR 95%
792
1,111
1,148 898
    Figure 20.3.a
 124
 124
 Jan-20 Feb-20
Mar-20 Apr-20
May-20 Jun-20
Jul-20 Aug-20
Sep-20 Oct-20
Nov-20 Dec-20
Jan-21 Feb-21
Mar-21 Apr-21
May-21 Jun-21
