
Page 145 - Scopus Scholarly Utilisation By Malaysian Public Tertiary Institutions 2020/21
P. 145
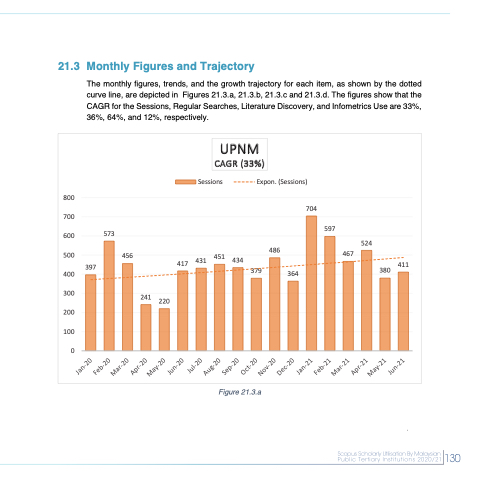
  21.3 Monthly Figures and Trajectory
The monthly figures, trends, and the growth trajectory for each item, as shown by the dotted curve line, are depicted in Figures 21.3.a, 21.3.b, 21.3.c and 21.3.d. The figures show that the CAGR for the Sessions, Regular Searches, Literature Discovery, and Infometrics Use are 33%, 36%, 64%, and 12%, respectively.
   800
700
600
500
400
300
200
100
0
573
456
486
704
597
524 467
380 411
397
Sessions
417 431 451 434
Expon. (Sessions)
                      241 220
UPNM CAGR (33%)
379
364
      Figure 21.3.a
 130
 130
 Jan-20 Feb-20
Mar-20 Apr-20
May-20 Jun-20
Jul-20 Aug-20
Sep-20 Oct-20
Nov-20 Dec-20
Jan-21 Feb-21
Mar-21 Apr-21
May-21 Jun-21
